AI-Powered Business System Development
Leveraging advanced AI-driven Low-Code technology, we deliver a wide range of business systems designed to maximize productivity without requiring additional coding or multiple solution adoption. Our integrated UI development platform enables users to streamline processes and enhance operational efficiency, ensuring superior outcomes for businesses.
- Cost_Efficiency
- Resource_Minimization
- Rapid_Deployment
- User_Friendly


We develop comprehensive business systems that analyze data to provide actionable insights, supporting strategic decision-making, situation analysis, forecasting, and overall management.
Traditionally, building business systems required the adoption of separate specialized solutions for BI, dashboards, reports, and UI. However, BI MATRIX offers an integrated UI development platform capable of supporting a variety of analytics interface development and system implementation needs within a single solution. This approach significantly enhances efficiency during system implementation while reducing costs and operational resources.
AI Technology for System Development
By leveraging AI-powered coding automation technology, analytical systems can be developed using a Low Code/No Code approach, without the need for SQL coding or JAVA programming knowledge. This not only simplifies the development process but also empowers junior and mid-level developers to efficiently develop systems. Additionally, the use of standardized code ensures seamless maintenance and reduces long-term complexity.
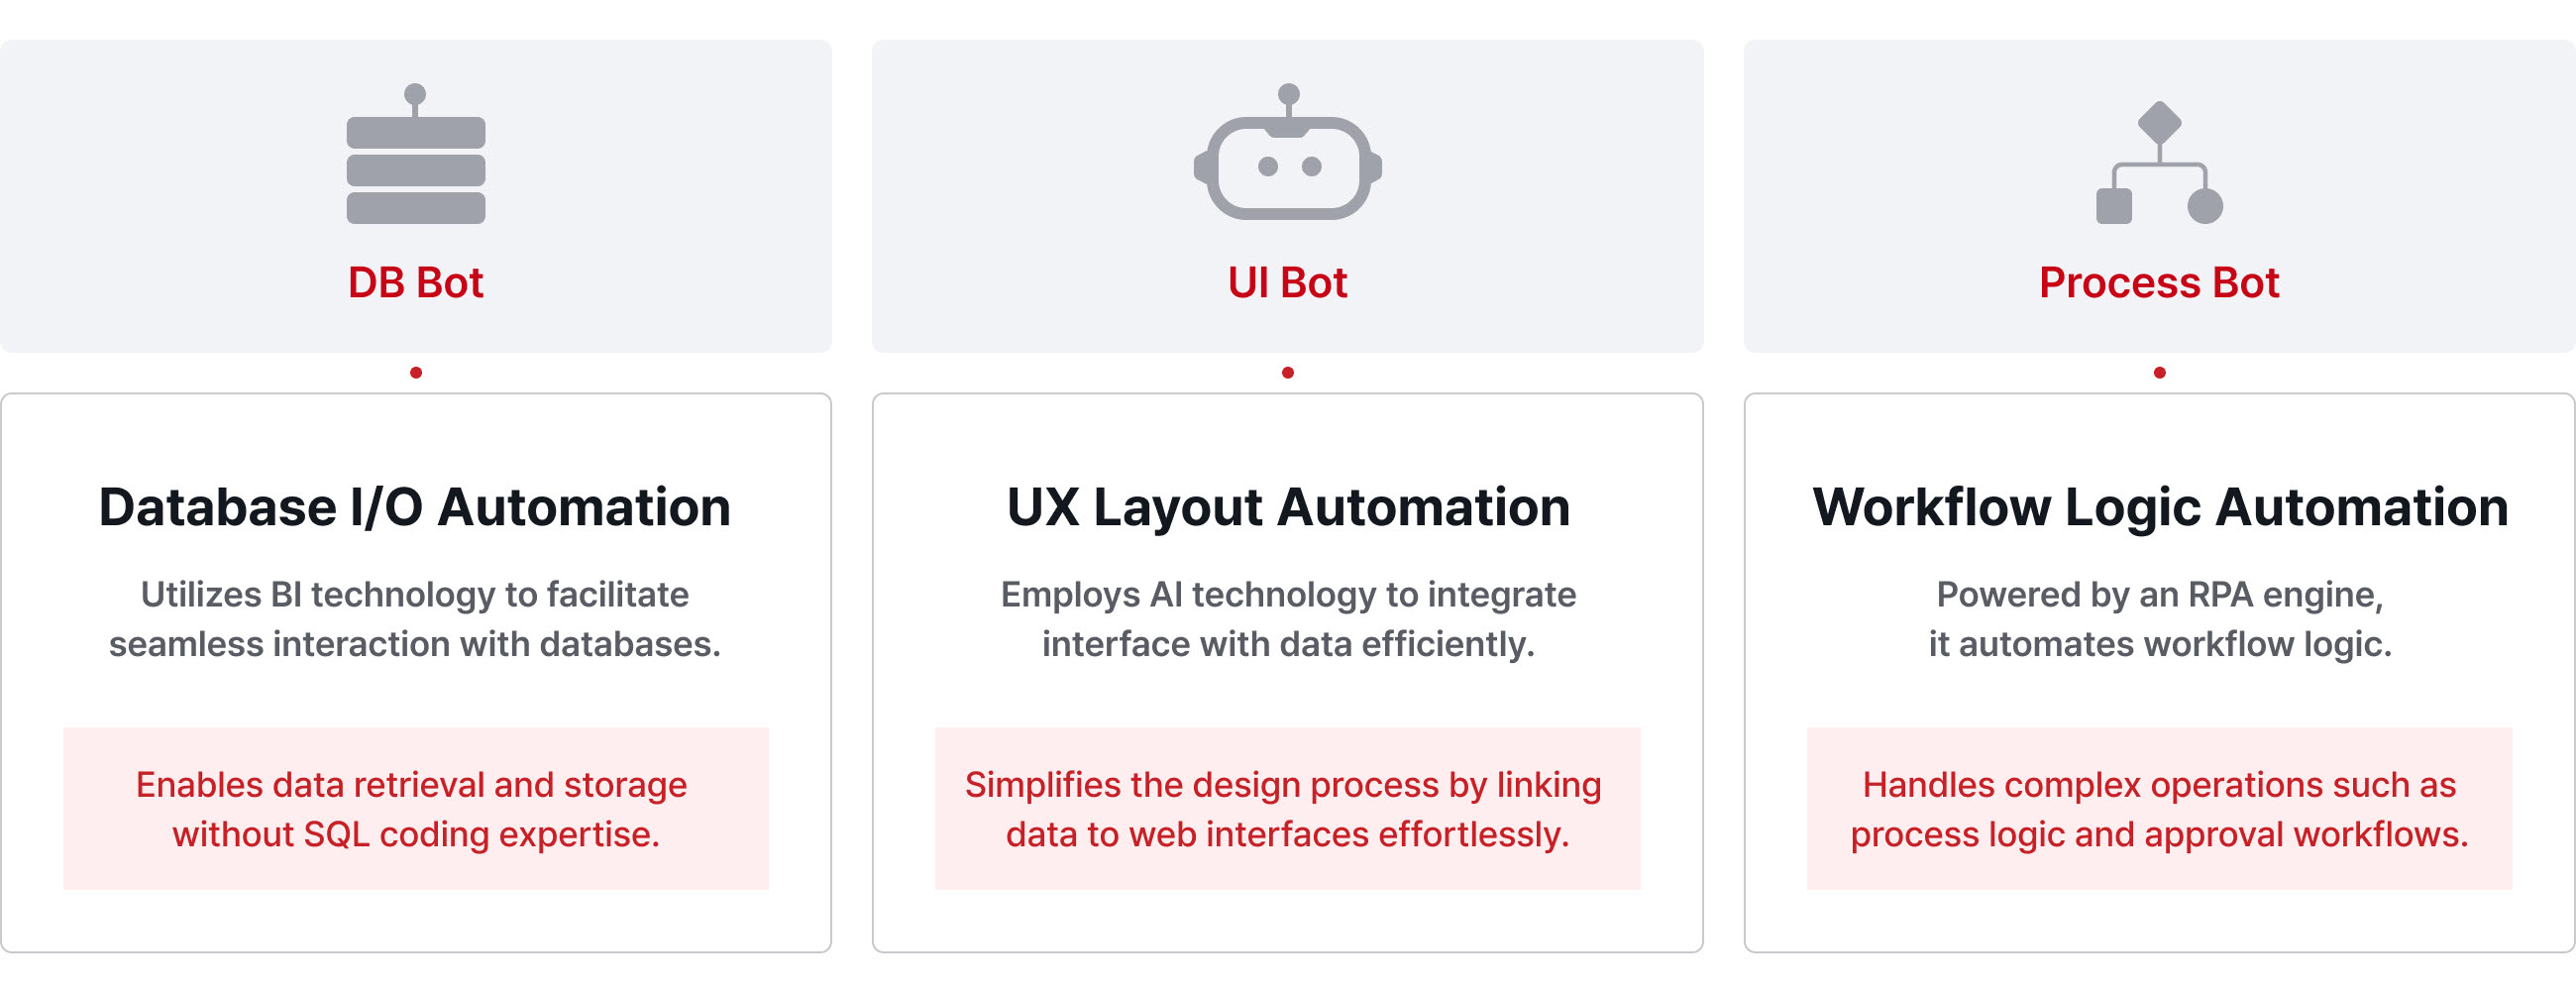
SW Robots (Software Robots)
Leverage AI-powered software robots to automate coding processes for business system development, enabling effortless development of system interfaces.
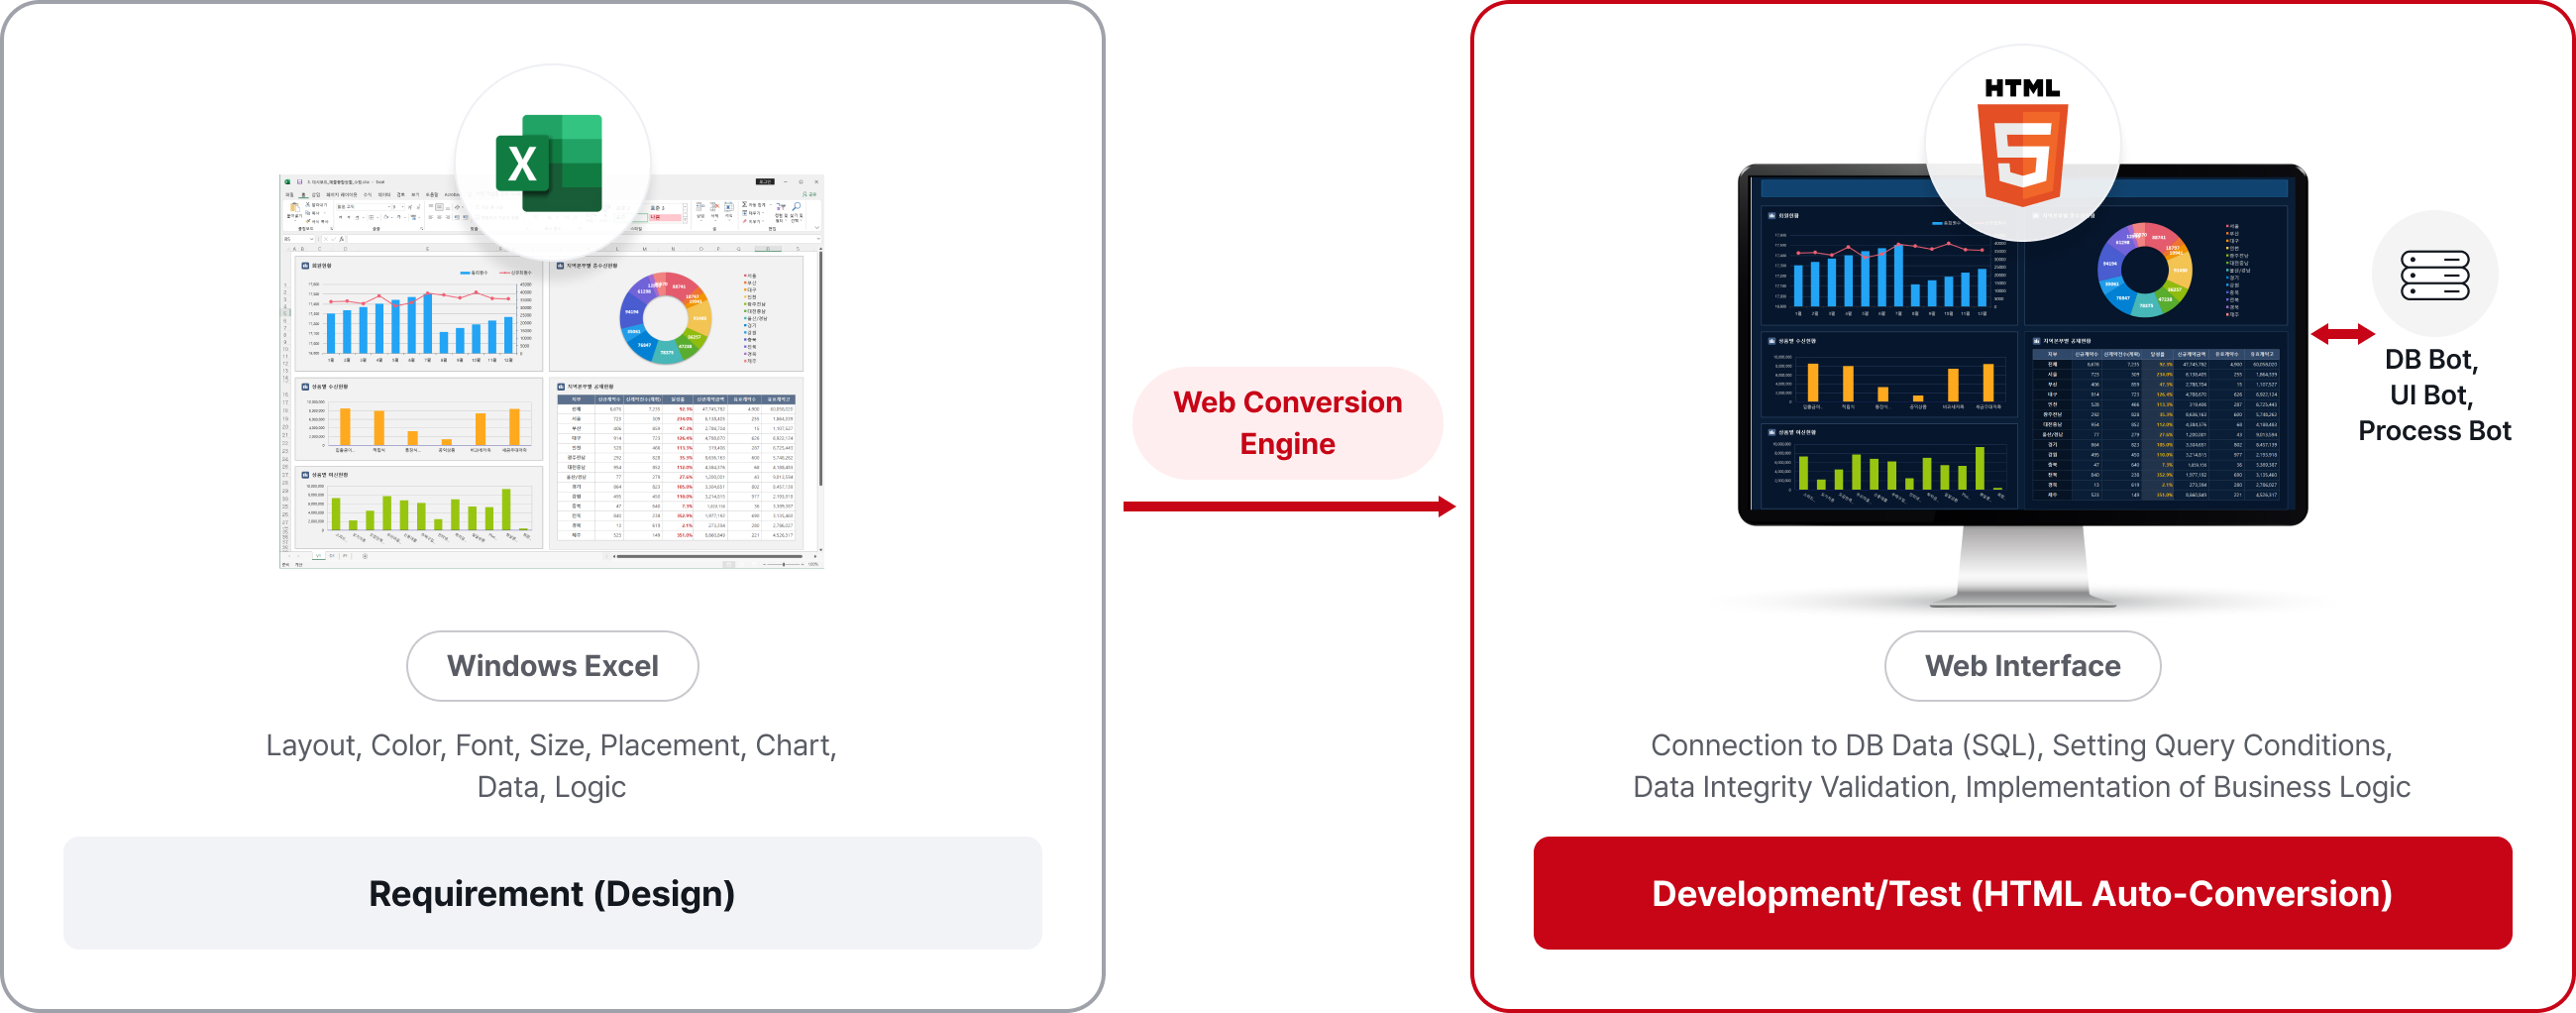
UI Bot’s Web Interfaces Auto-Development Feature
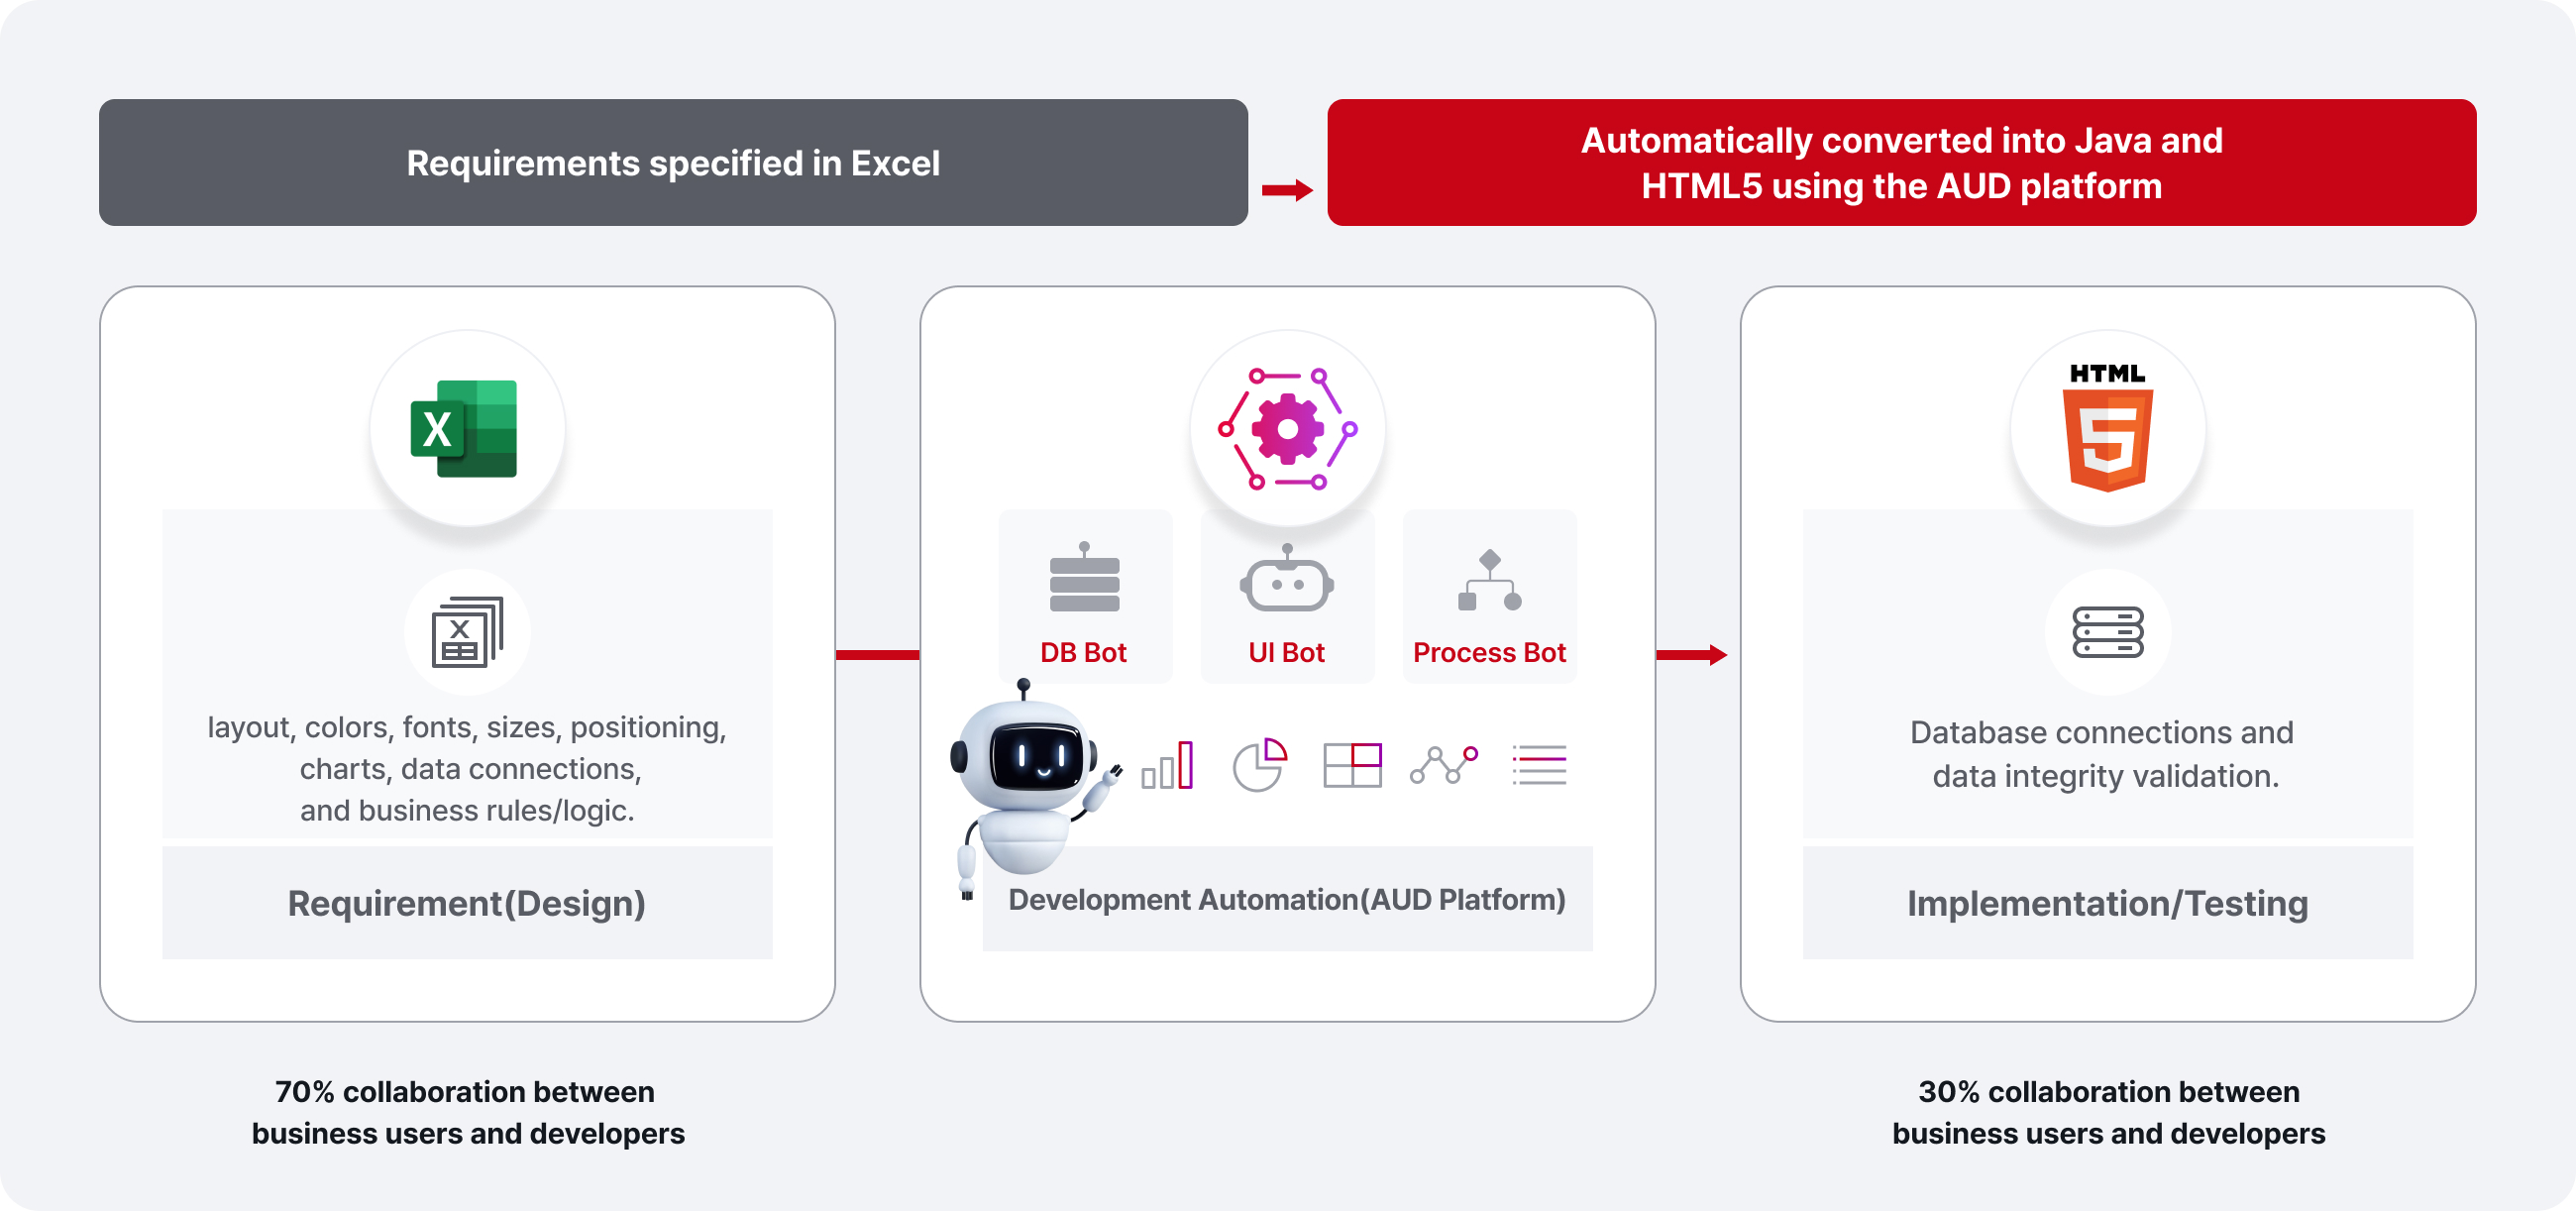
Design interfaces in Excel, and the UI Bot automatically converts them into HTML5 web.
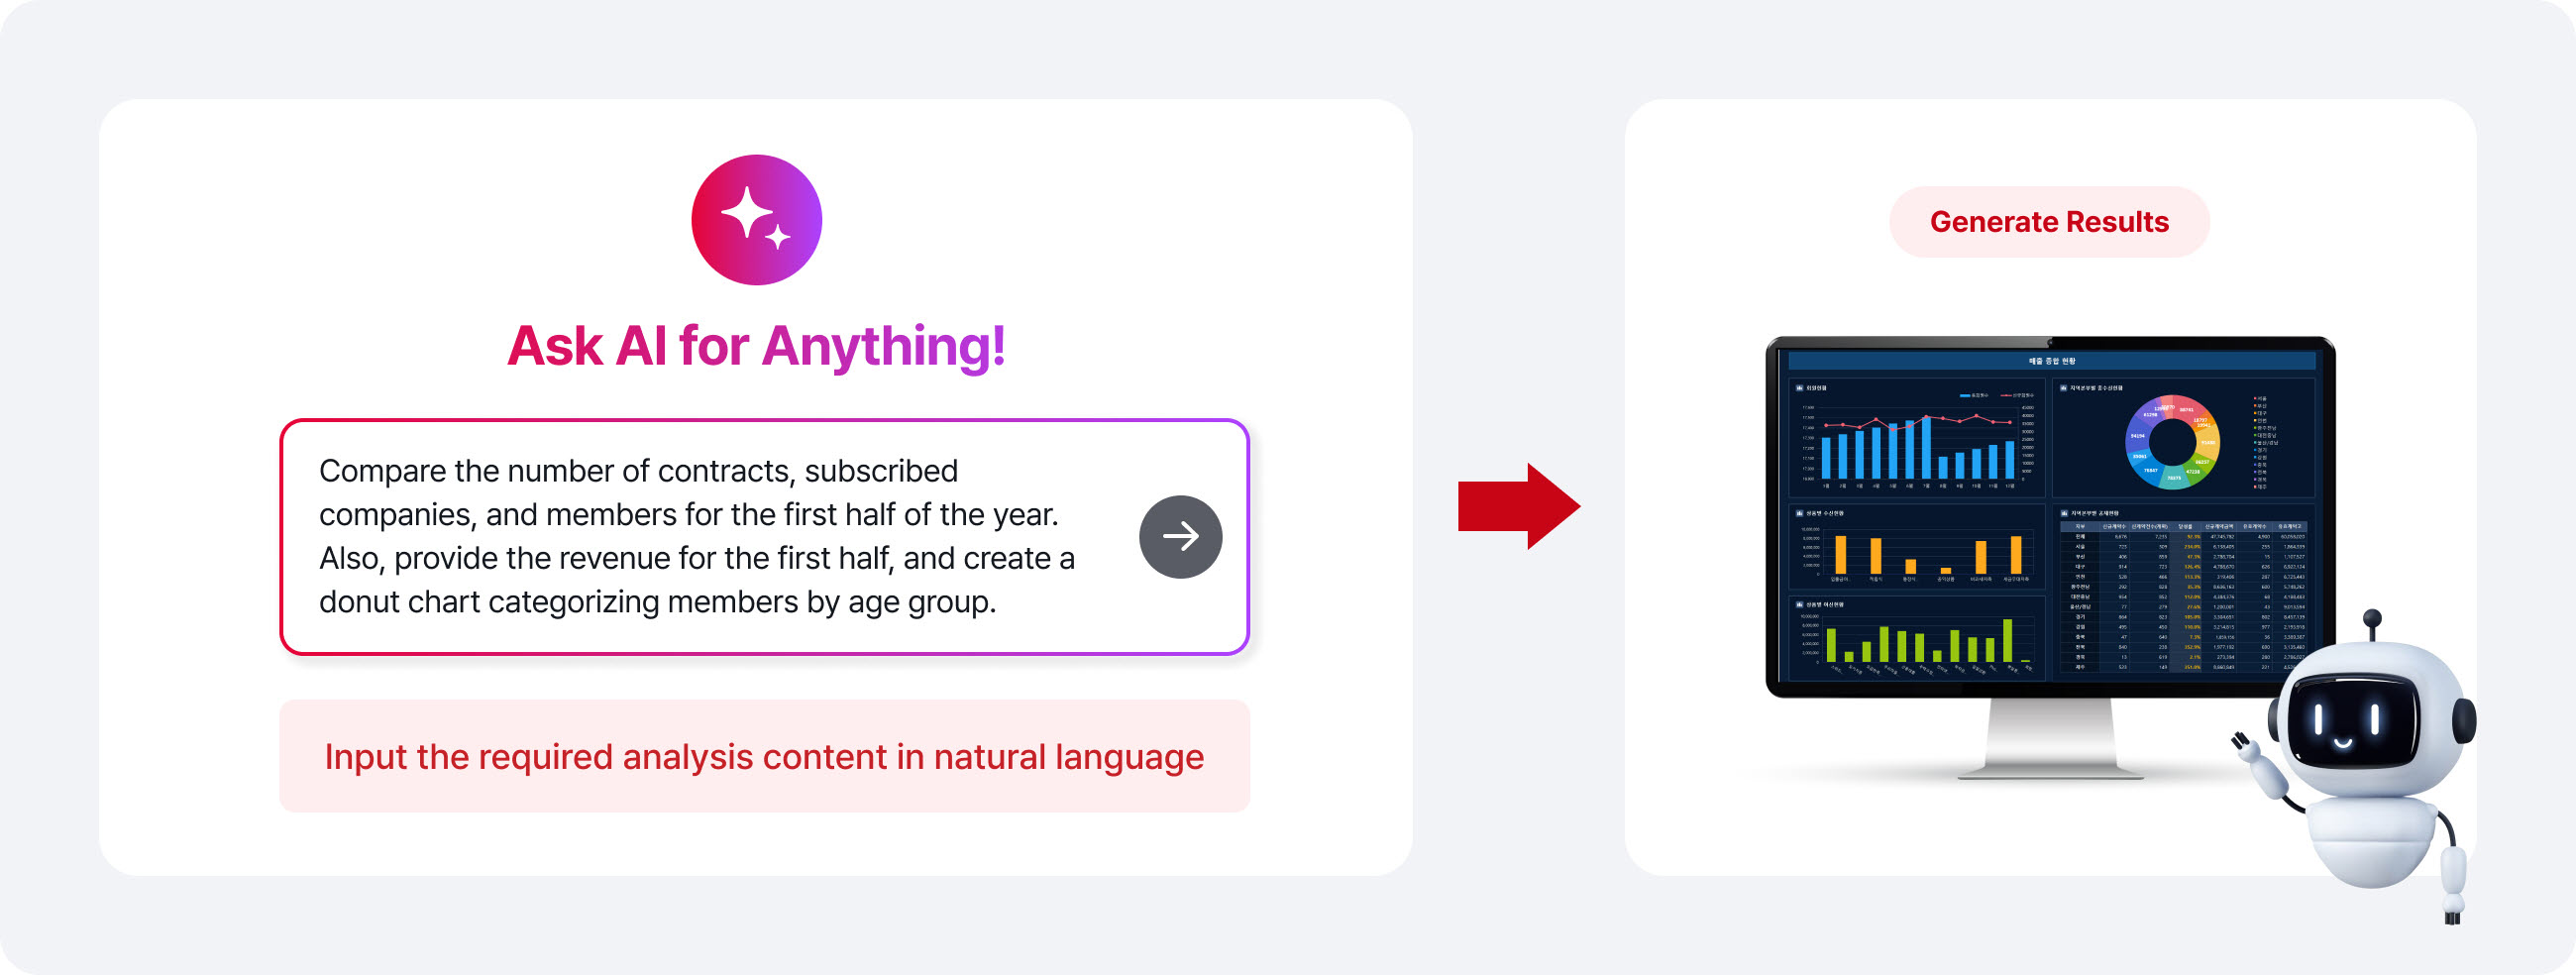
G-MATRIX Copilot
Powered by generative AI technology, G-MATRIX Copilot automatically generates data analytics interfaces. Users can simply input development requirements in natural language, and the platform seamlessly creates the corresponding data analysis interfaces.
Scope of Business System Development
We specialize in developing a wide range of systems that were traditionally built using software tools (BI, dashboards, visualization, UI/UX, reporting) or directly through programming languages.
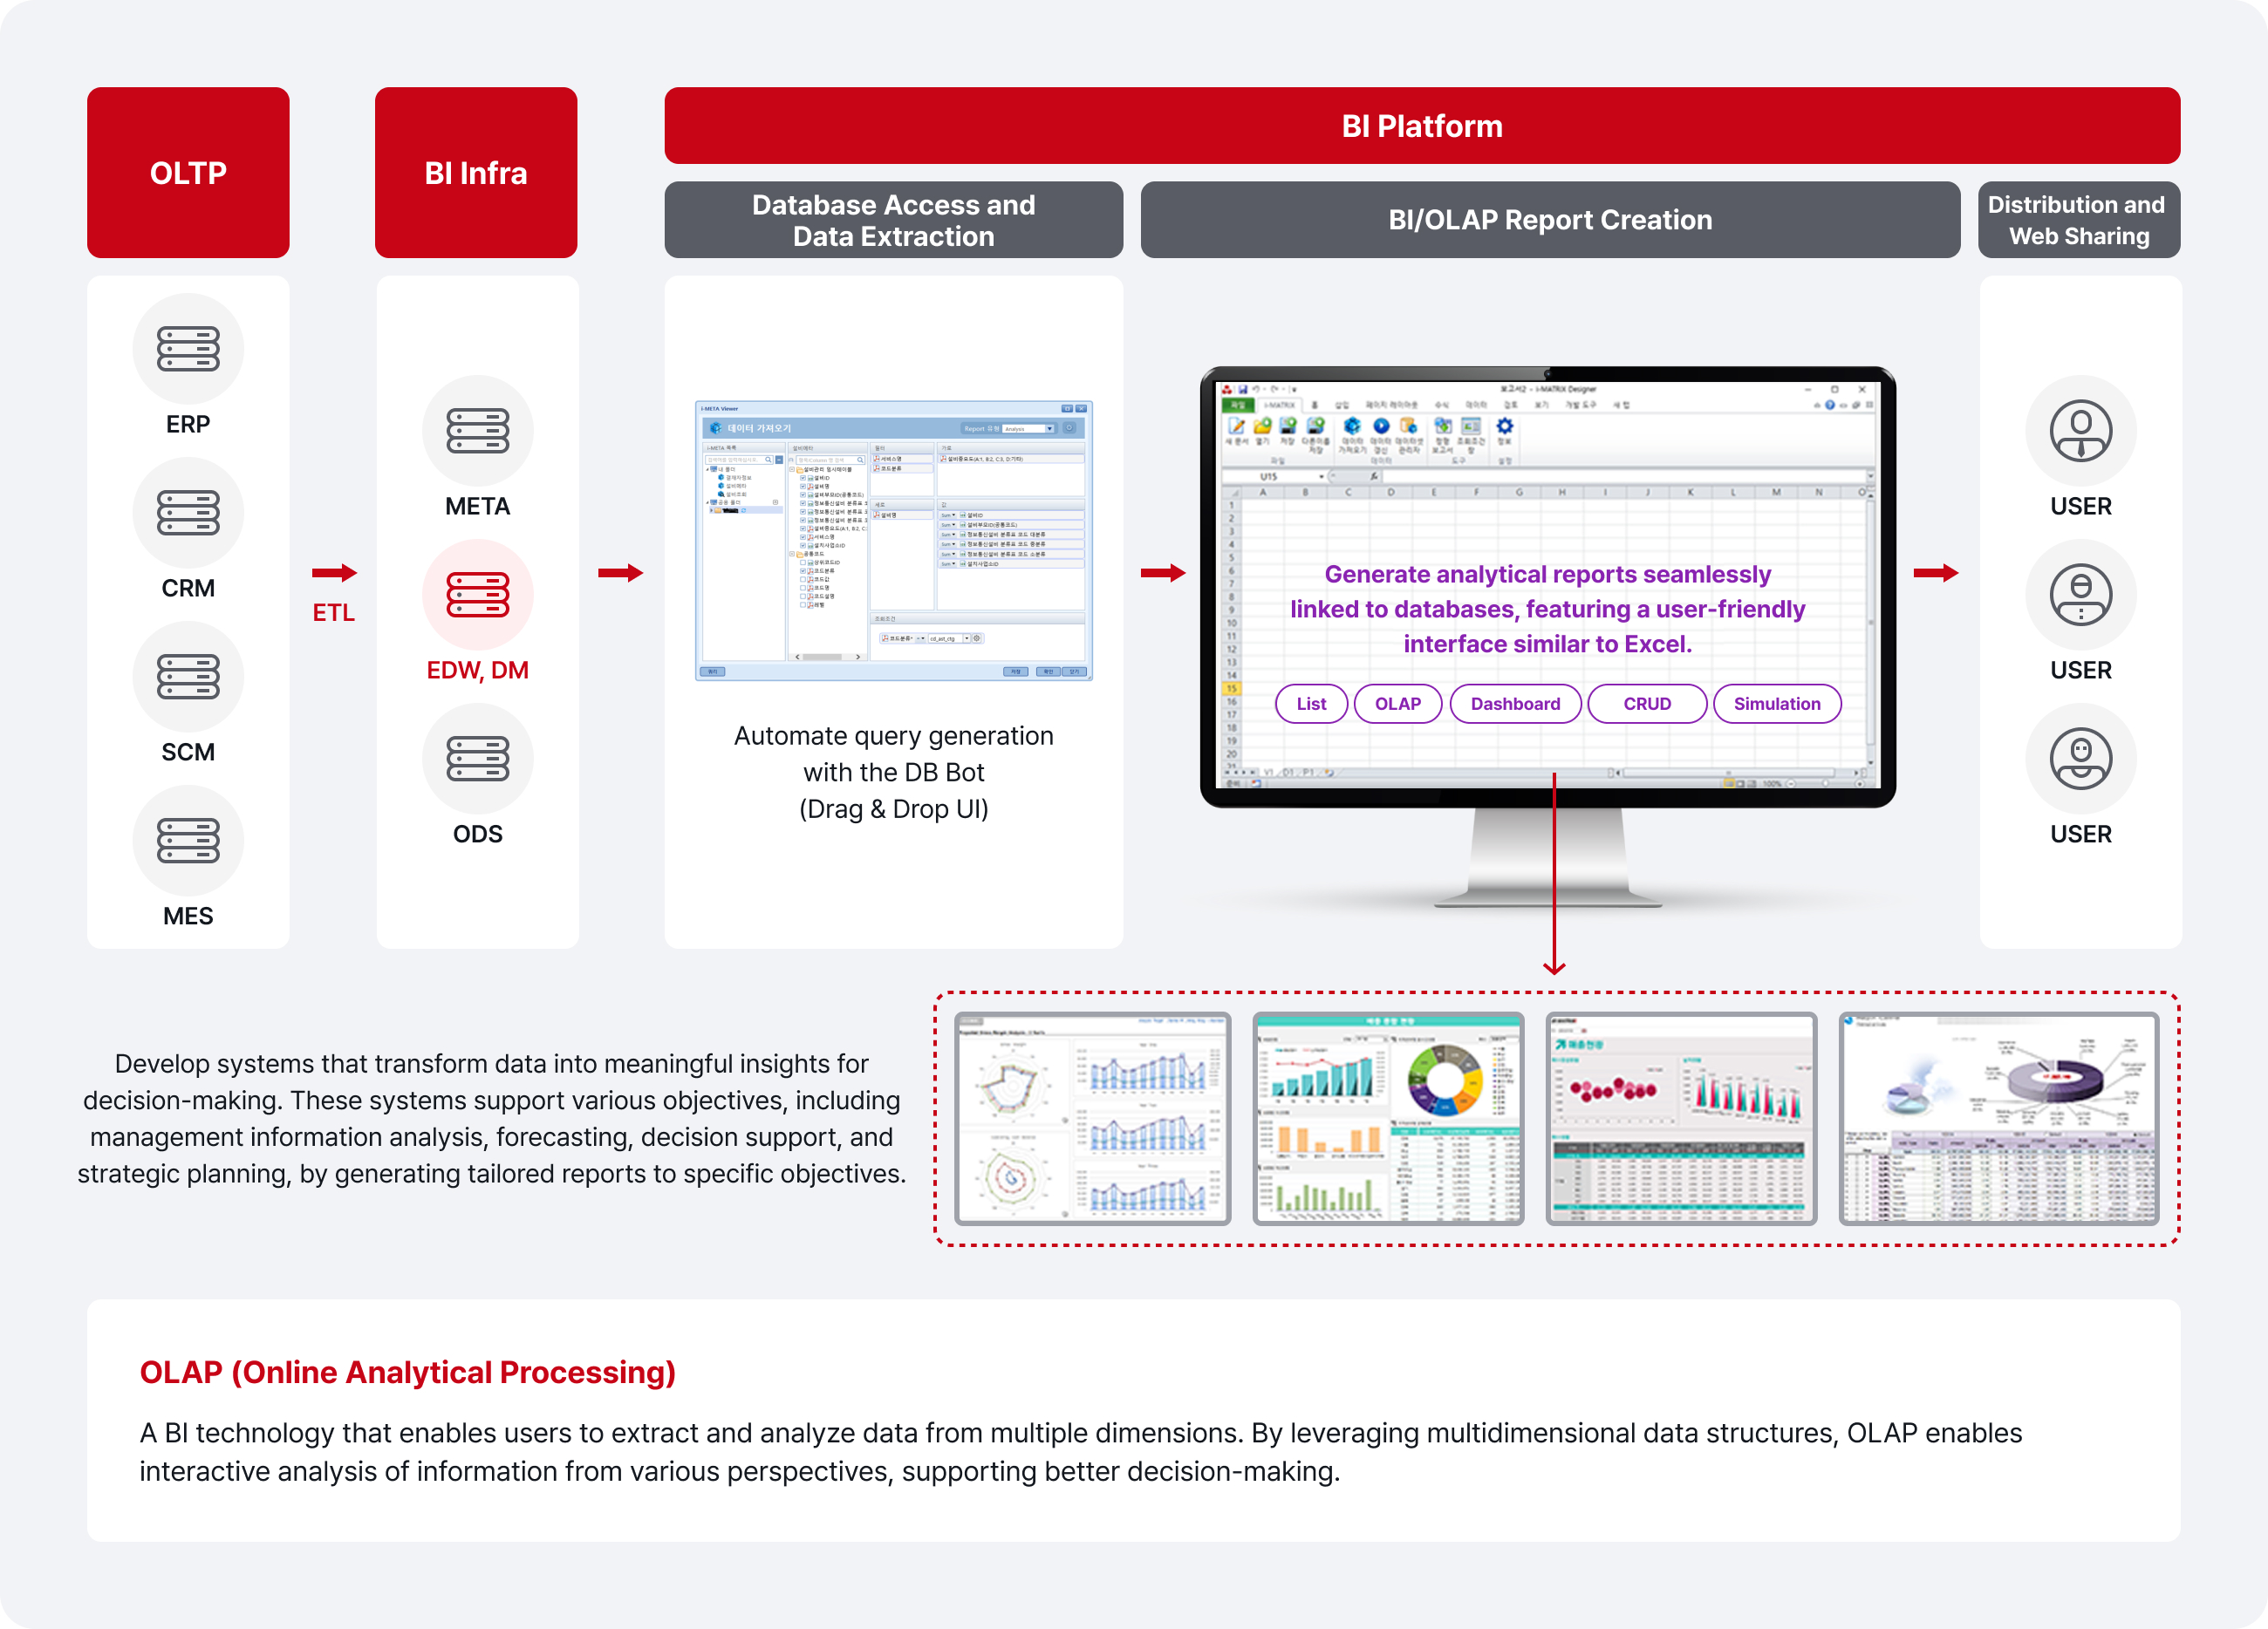
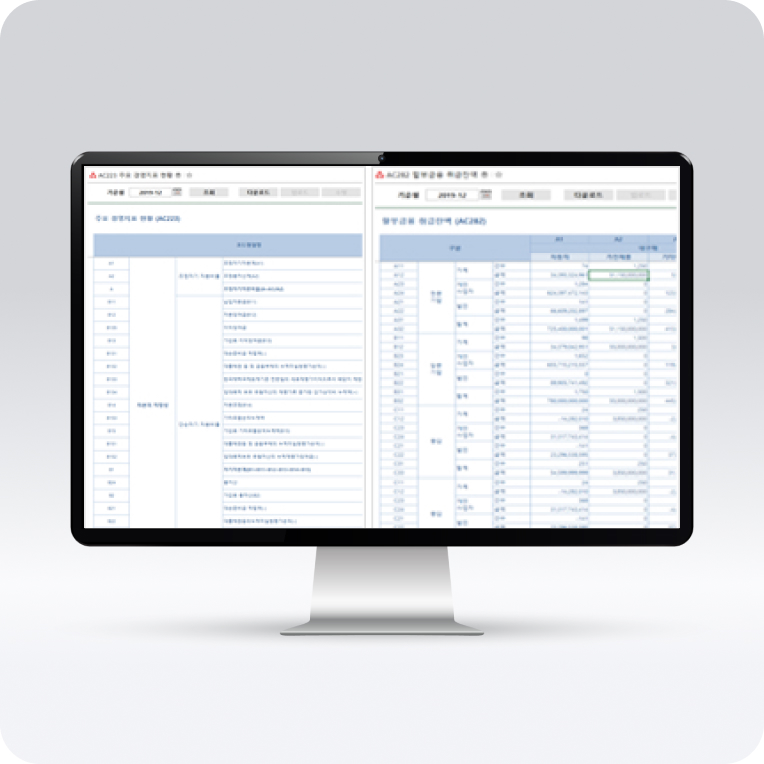
BI/OLAP
We build BI/OLAP systems that enable users to directly leverage enterprise data from ERP, DW, CRM, and SCM systems, transforming it into actionable insights for accurate decision-making. Users can access databases directly to easily and efficiently extract and process the required data. They can also generate various types of analytic results and share them with other users.
Features
- Scalable System Deployment: Supports BI system implementation for organizations of all sizes, from small business to enterprise-level solutions.
- Comprehensive BI Functionality: Seamlessly handle the entire spectrum of data analytics tasks, including data extraction, BI report development, distribution, and sharing, with quick and efficient web-based operations.
- Easy Maintenance: Simplified system maintenance ensures smooth operation with minimal technical effort.
- User-Friendly Operation: Unlike traditional BI tools with complex interfaces, users without knowledge of database structures or query language can easily query data and perform ad-hoc multidimensional analysis using only basic Excel knowledge. BI reports can be created and utilized effortlessly.
- Excel Compatibility: Fully compatible with Excel, allowing users to directly leverage Excel formulas, functions, and more within the BI system for enhanced usability.
- High Development Productivity: Features various development SDKs and standardized templates to significantly accelerate BI report development, saving time and resources.
- Flexible Data Environment: Supports heterogeneous database environments and enables the development of complex screens with diverse structures.
- Additional Features: Export data in various formats, including CSV, HTML, Excel, and HWP.
- Implementation of Various Output Formats: Enables a variety of analytical views, including Grid, OLAP, and Tree structures, for comprehensive data visualization and analysis.
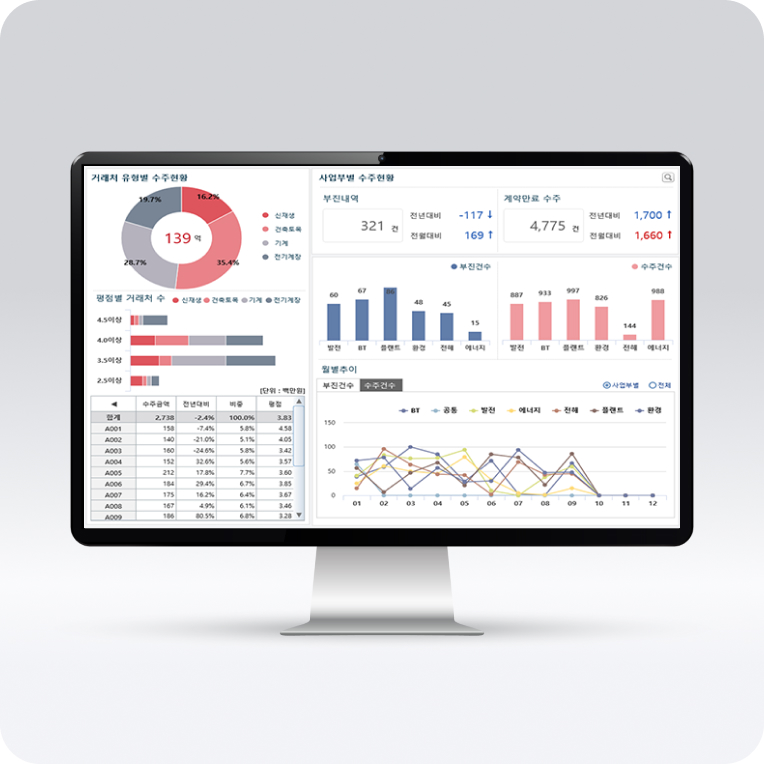
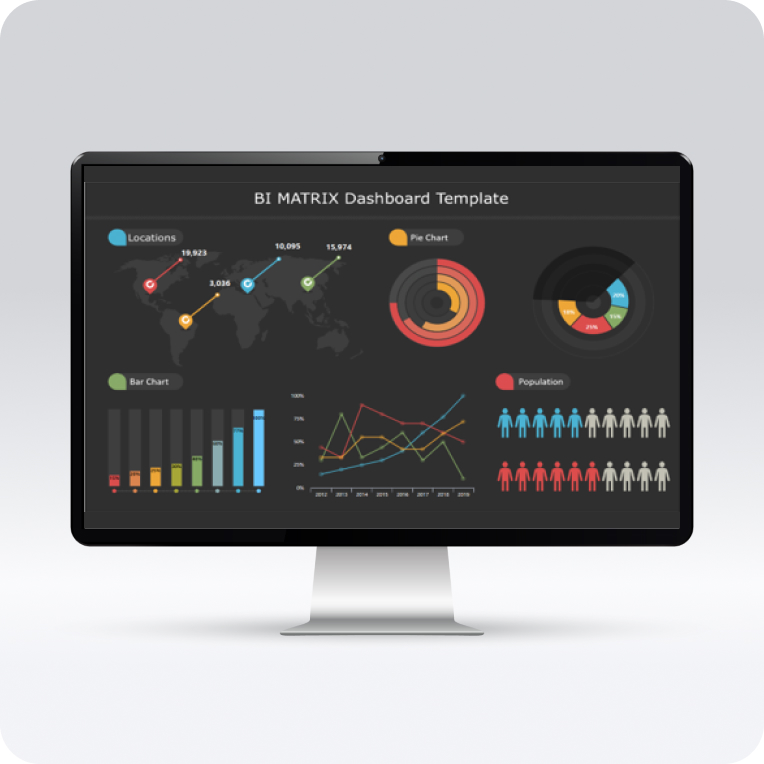
Dashboard / Visualization
We offer sleek, intuitive dashboard and visualization systems designed to facilitate comprehensive analysis of operational statuses. These systems provide a user-friendly interface that supports both correlation and detailed analysis in a unified environment. By leveraging dedicated web components and custom visuals, users can create dashboards in a wide variety of styles to suit their needs.
Dashboard
- Diverse view configurations tailored to analysis objectives
- Provide comprehensive information for decision-making through view designed for correlation and detailed analysis.
- Offer a multidimensional analysis environment based on scenarios to analyze current statuses and risk factors in-depth.
- Build dynamic and effective EIS (Executive Information Systems) and dashboards with features such as real-time data updates, map-integrated reports, and status boards.
- Incorporate Flash-style charts, gauges, and 3D visuals to create visually compelling dashboards.
- Provide dynamic charts that instantly adapt to changes in data.
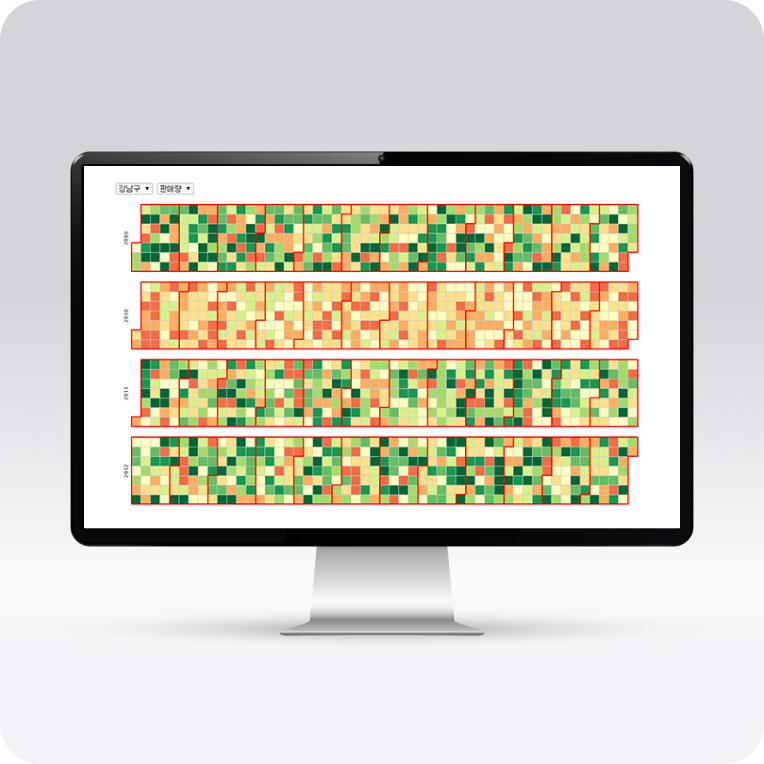
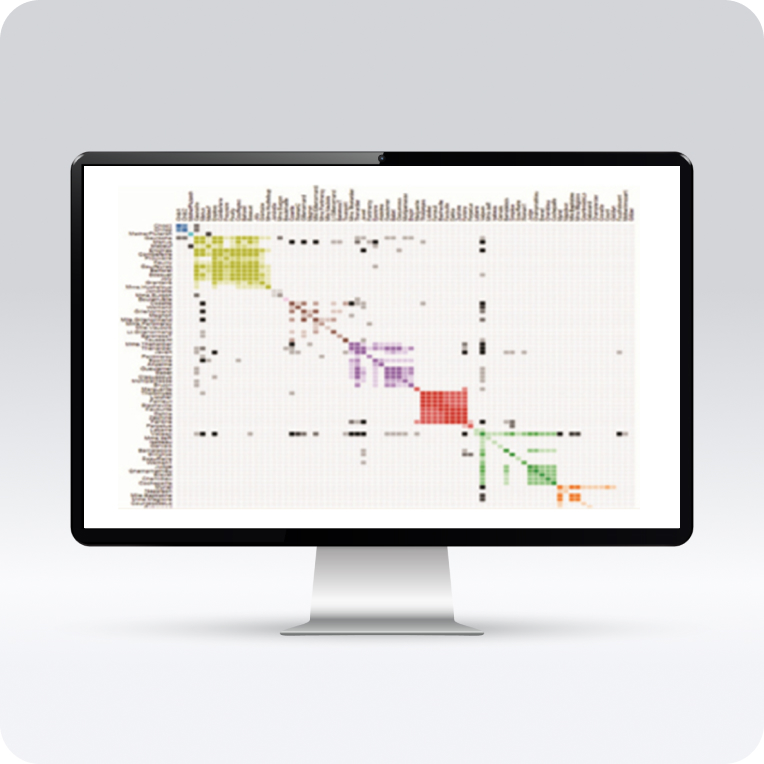
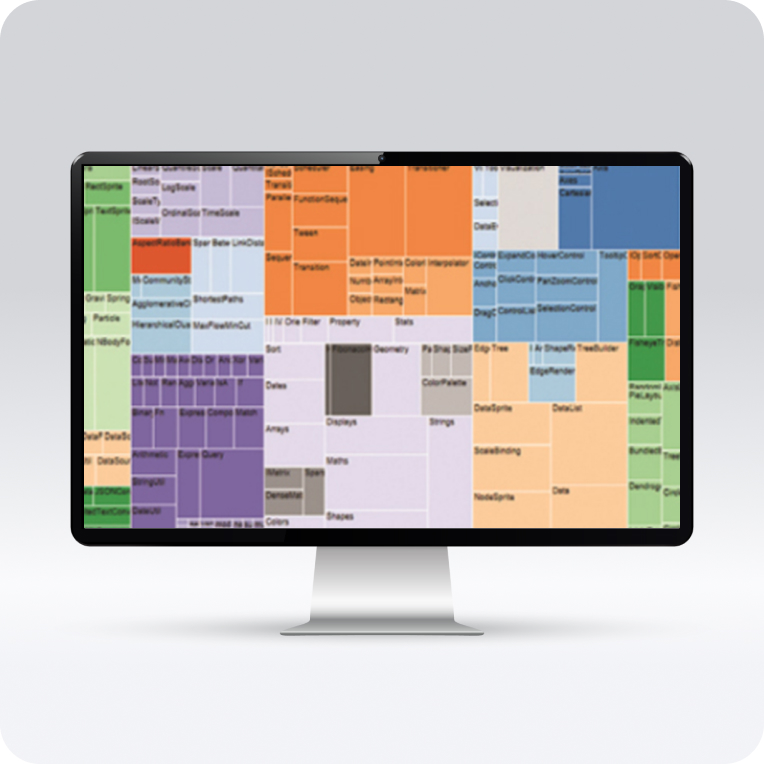
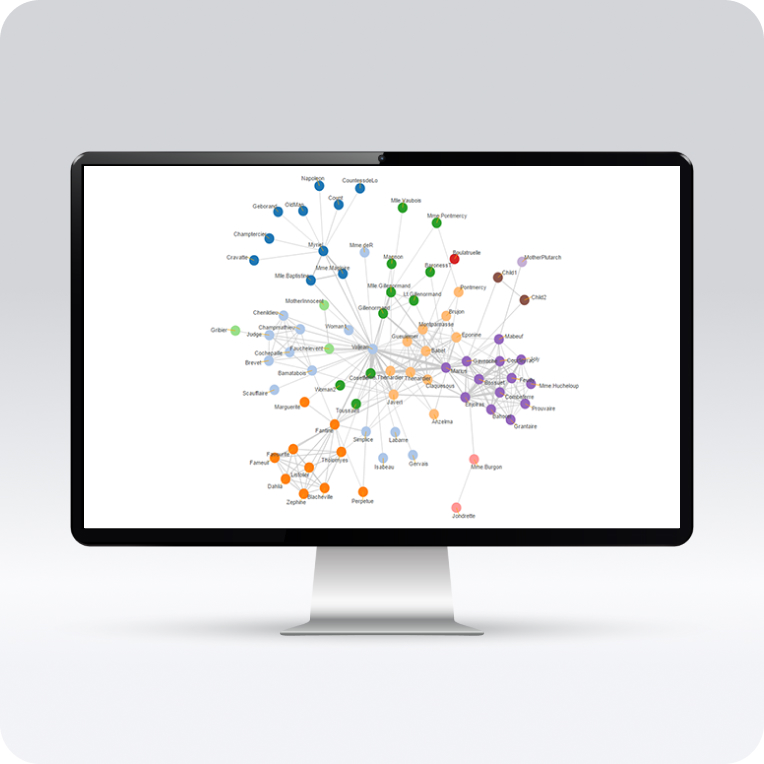
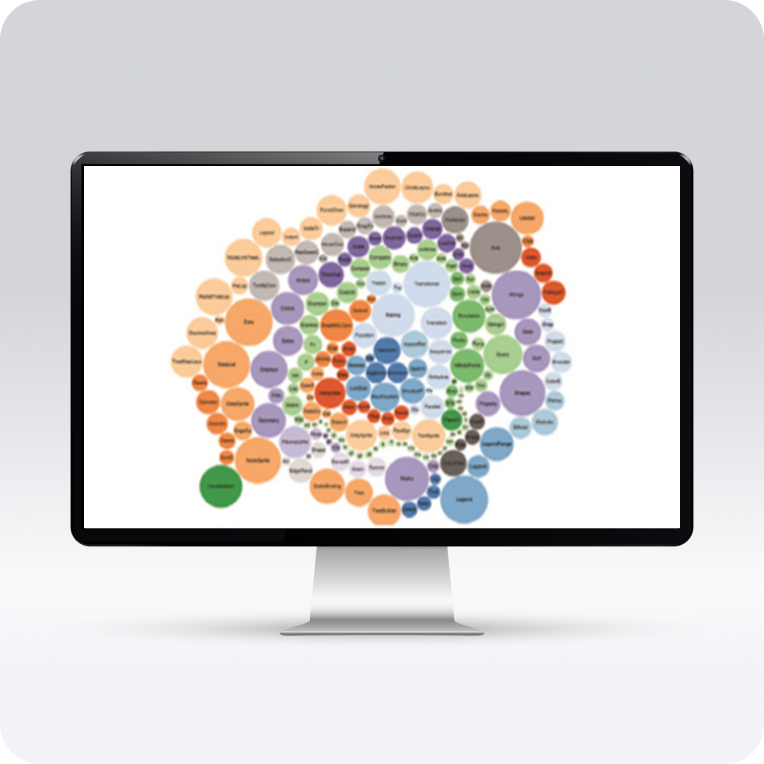
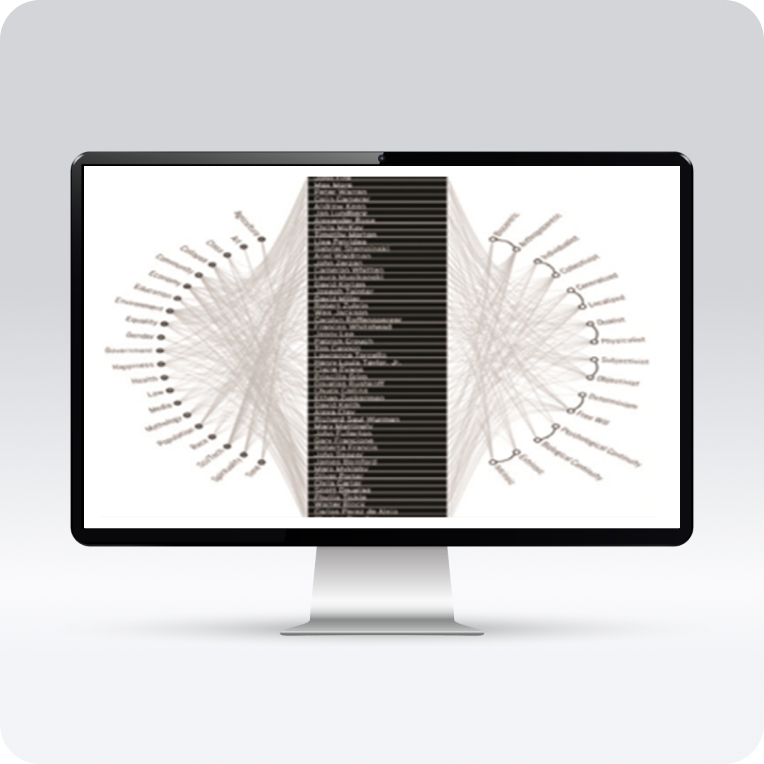
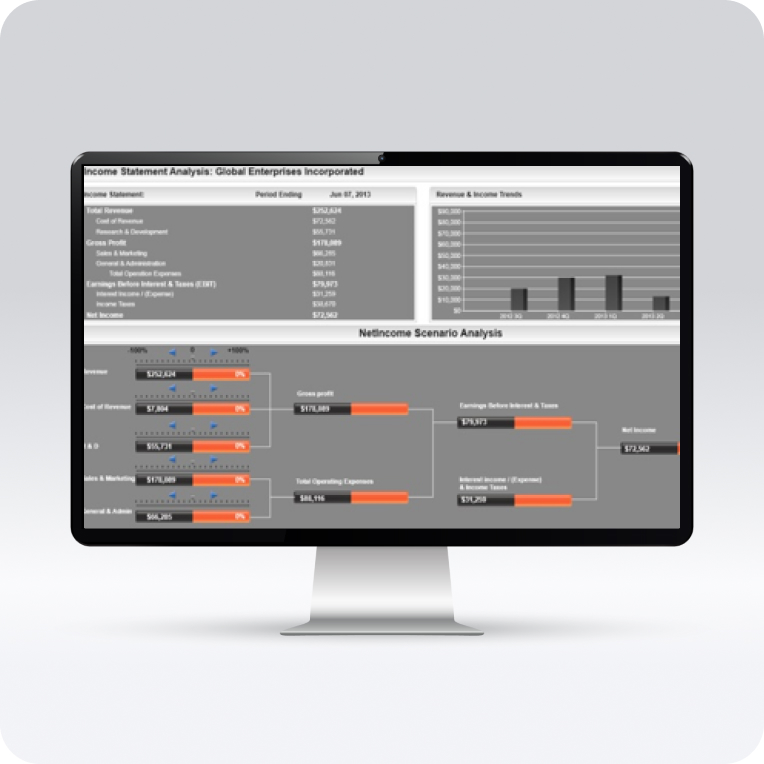
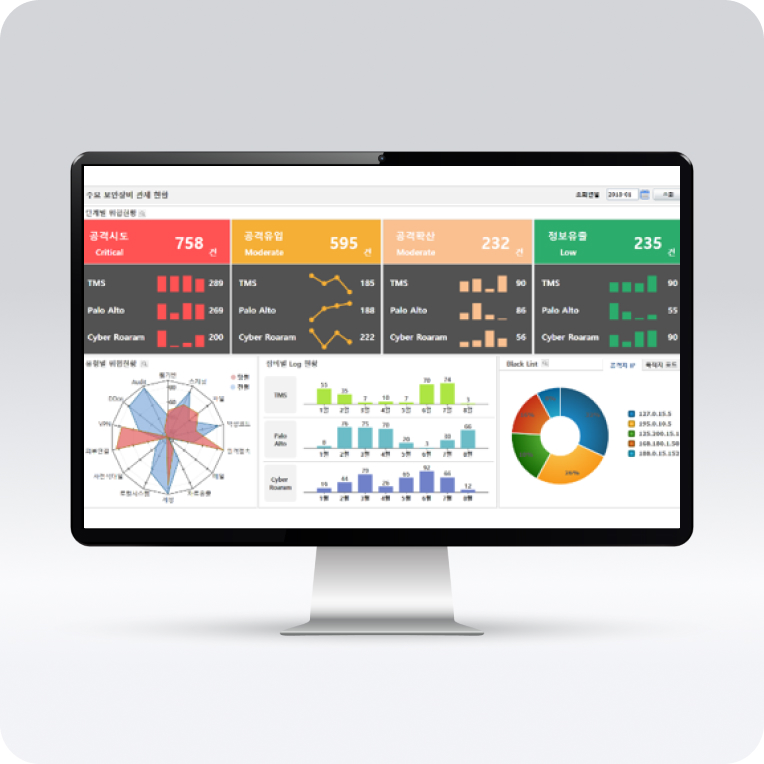
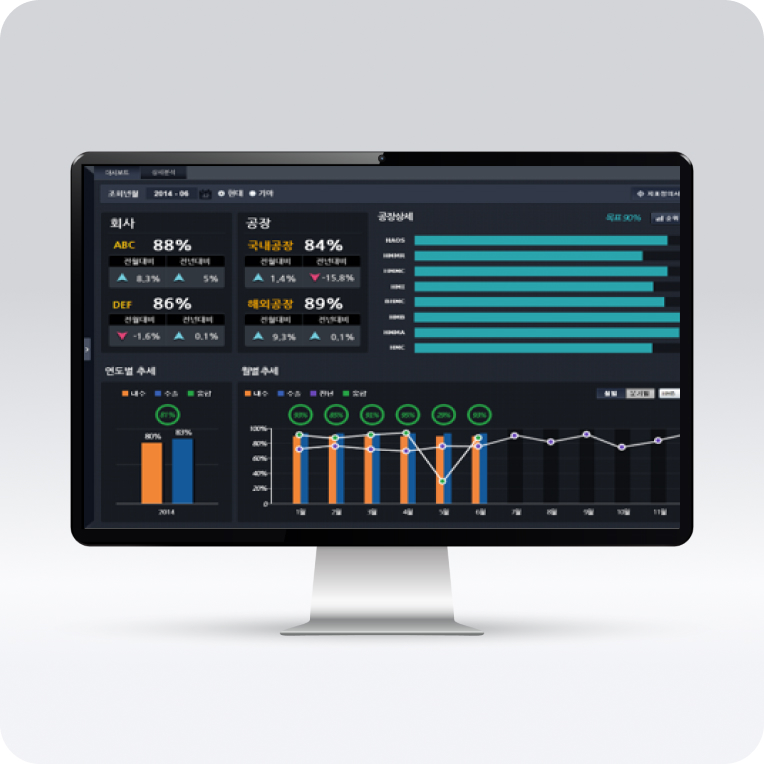
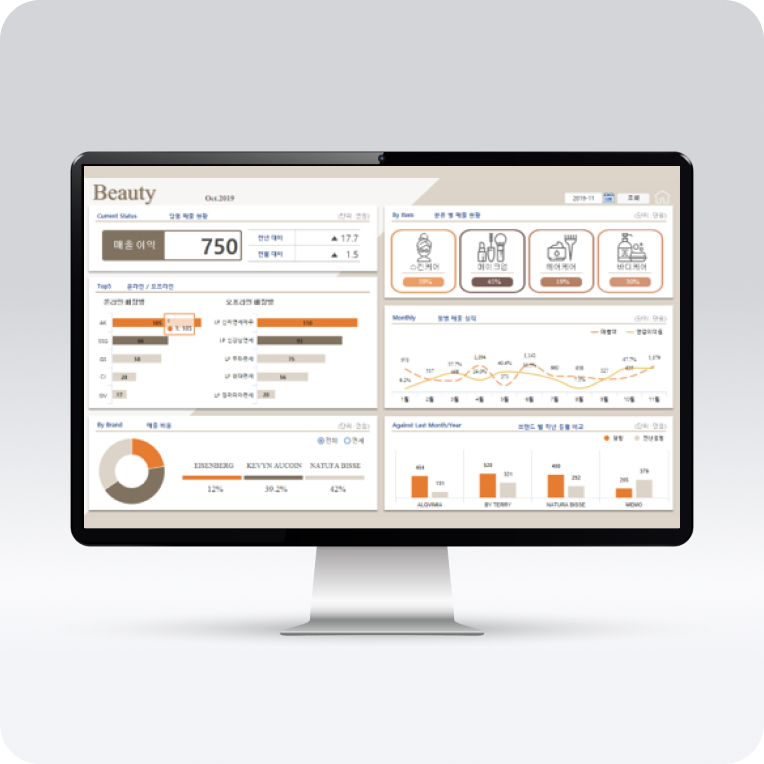
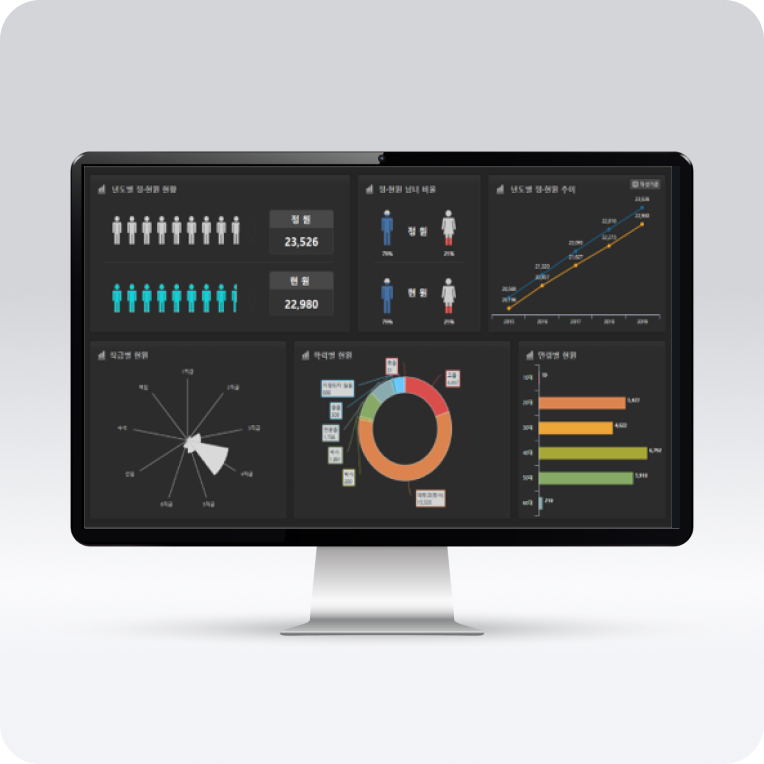
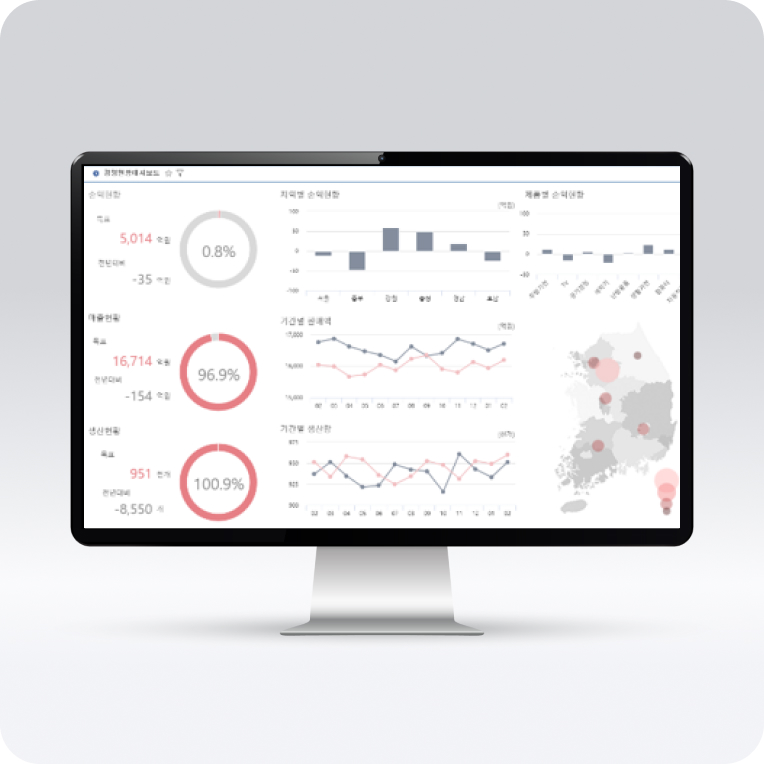
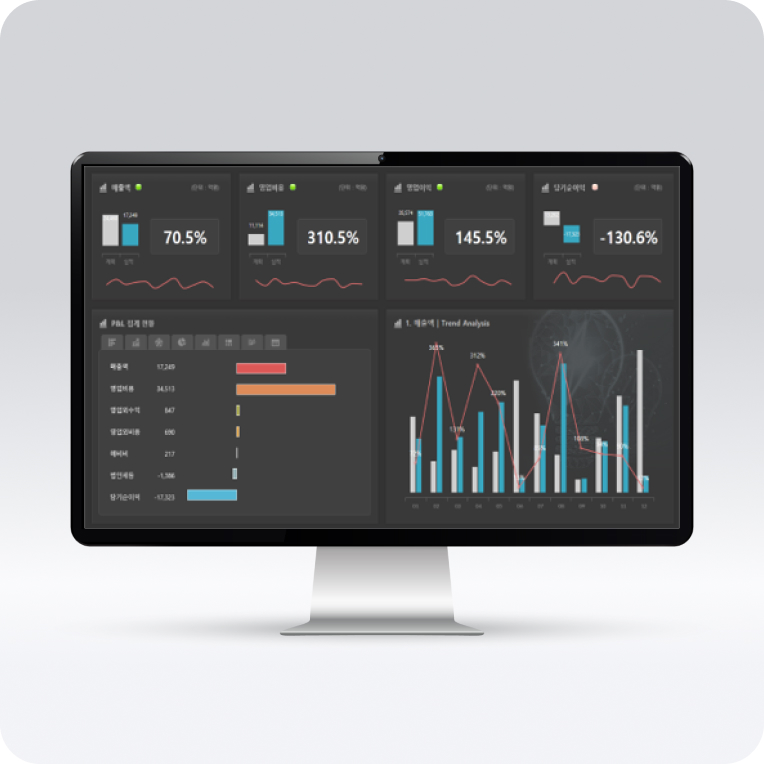
Visualization
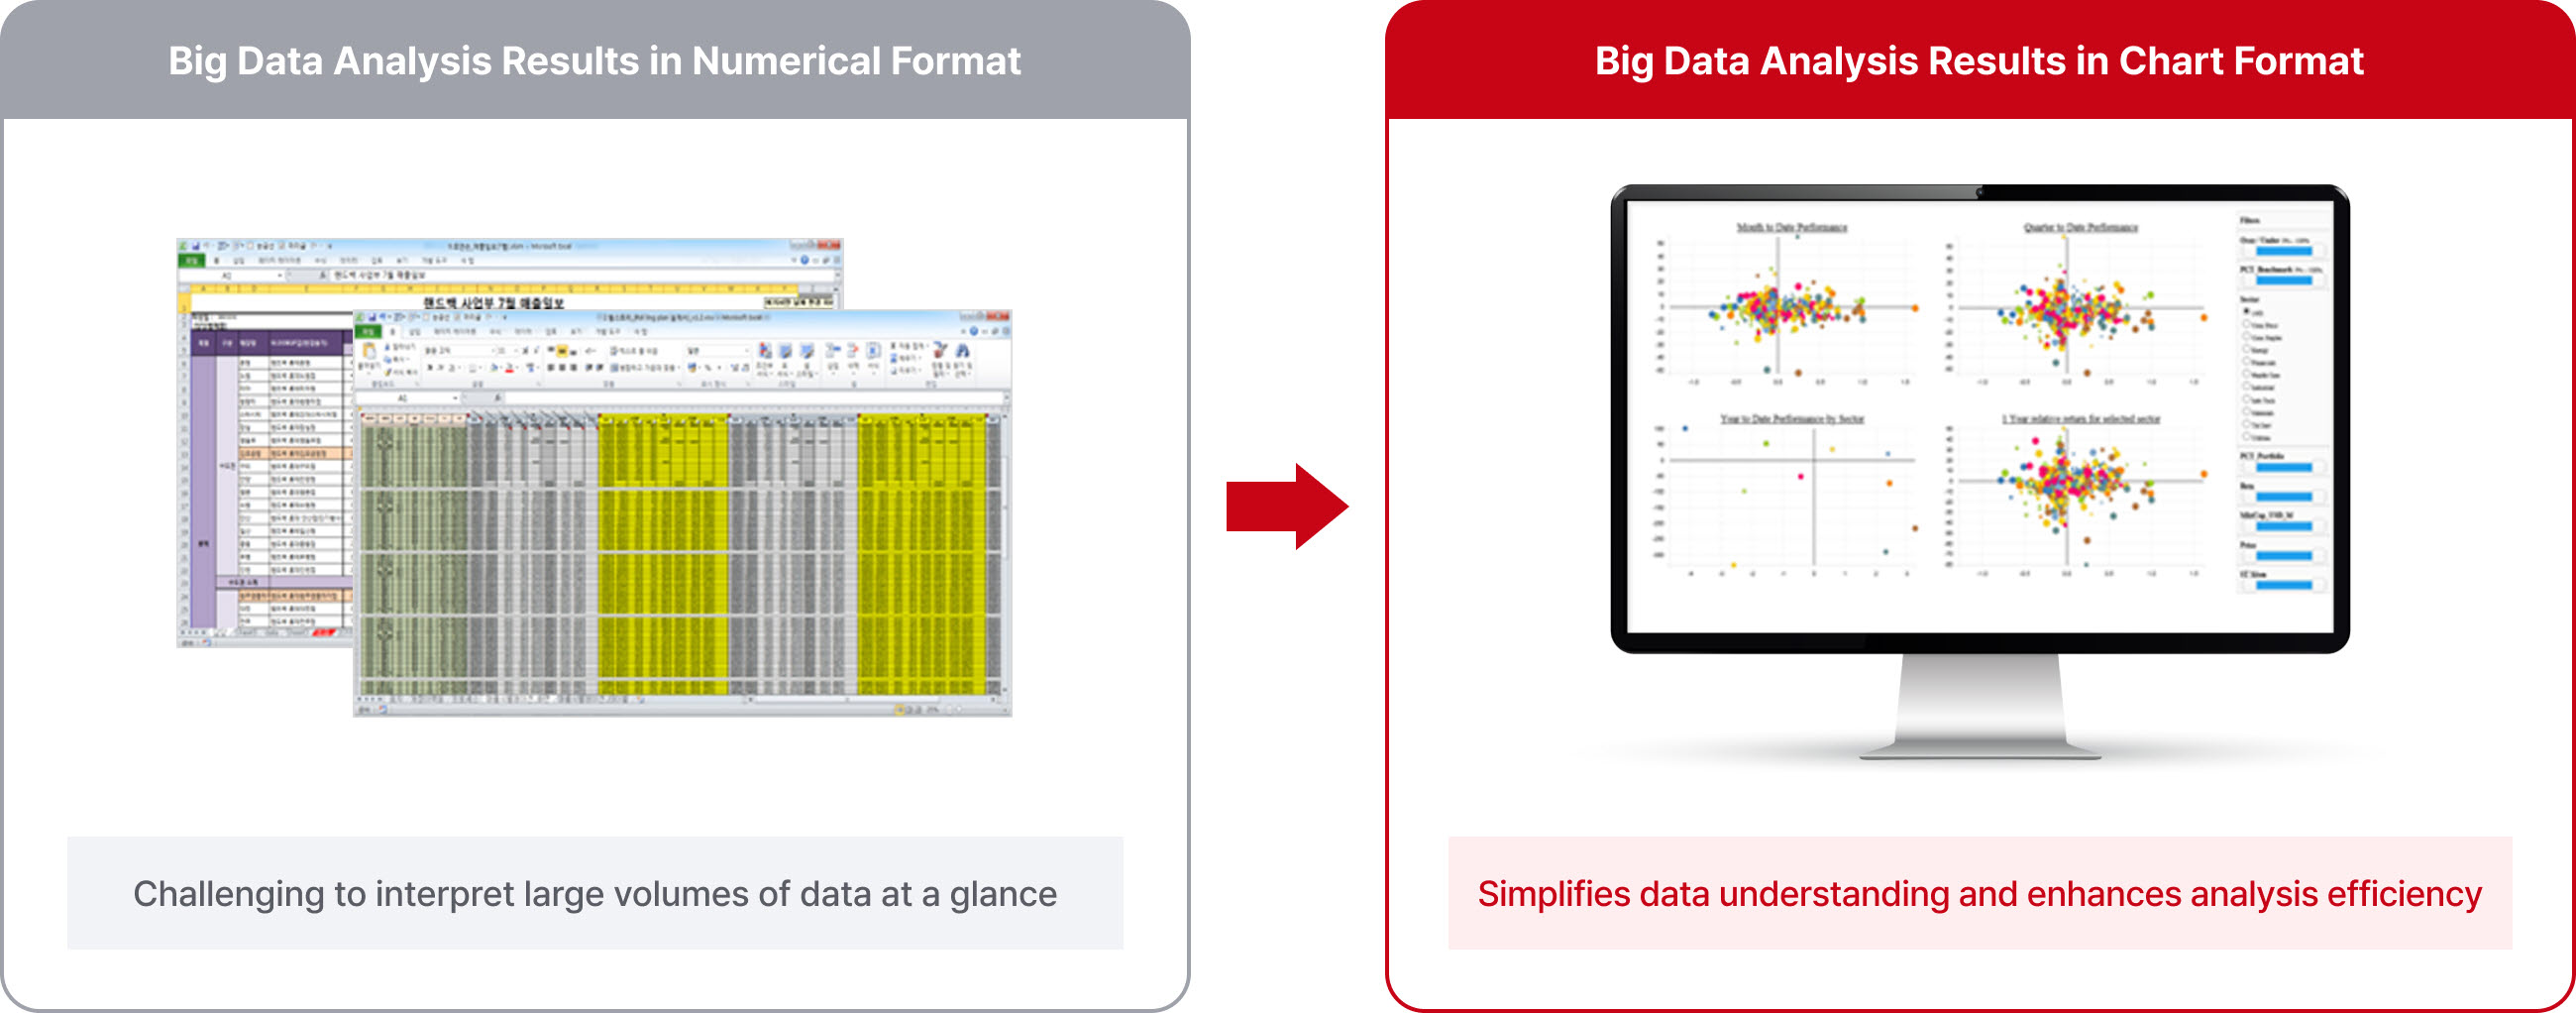
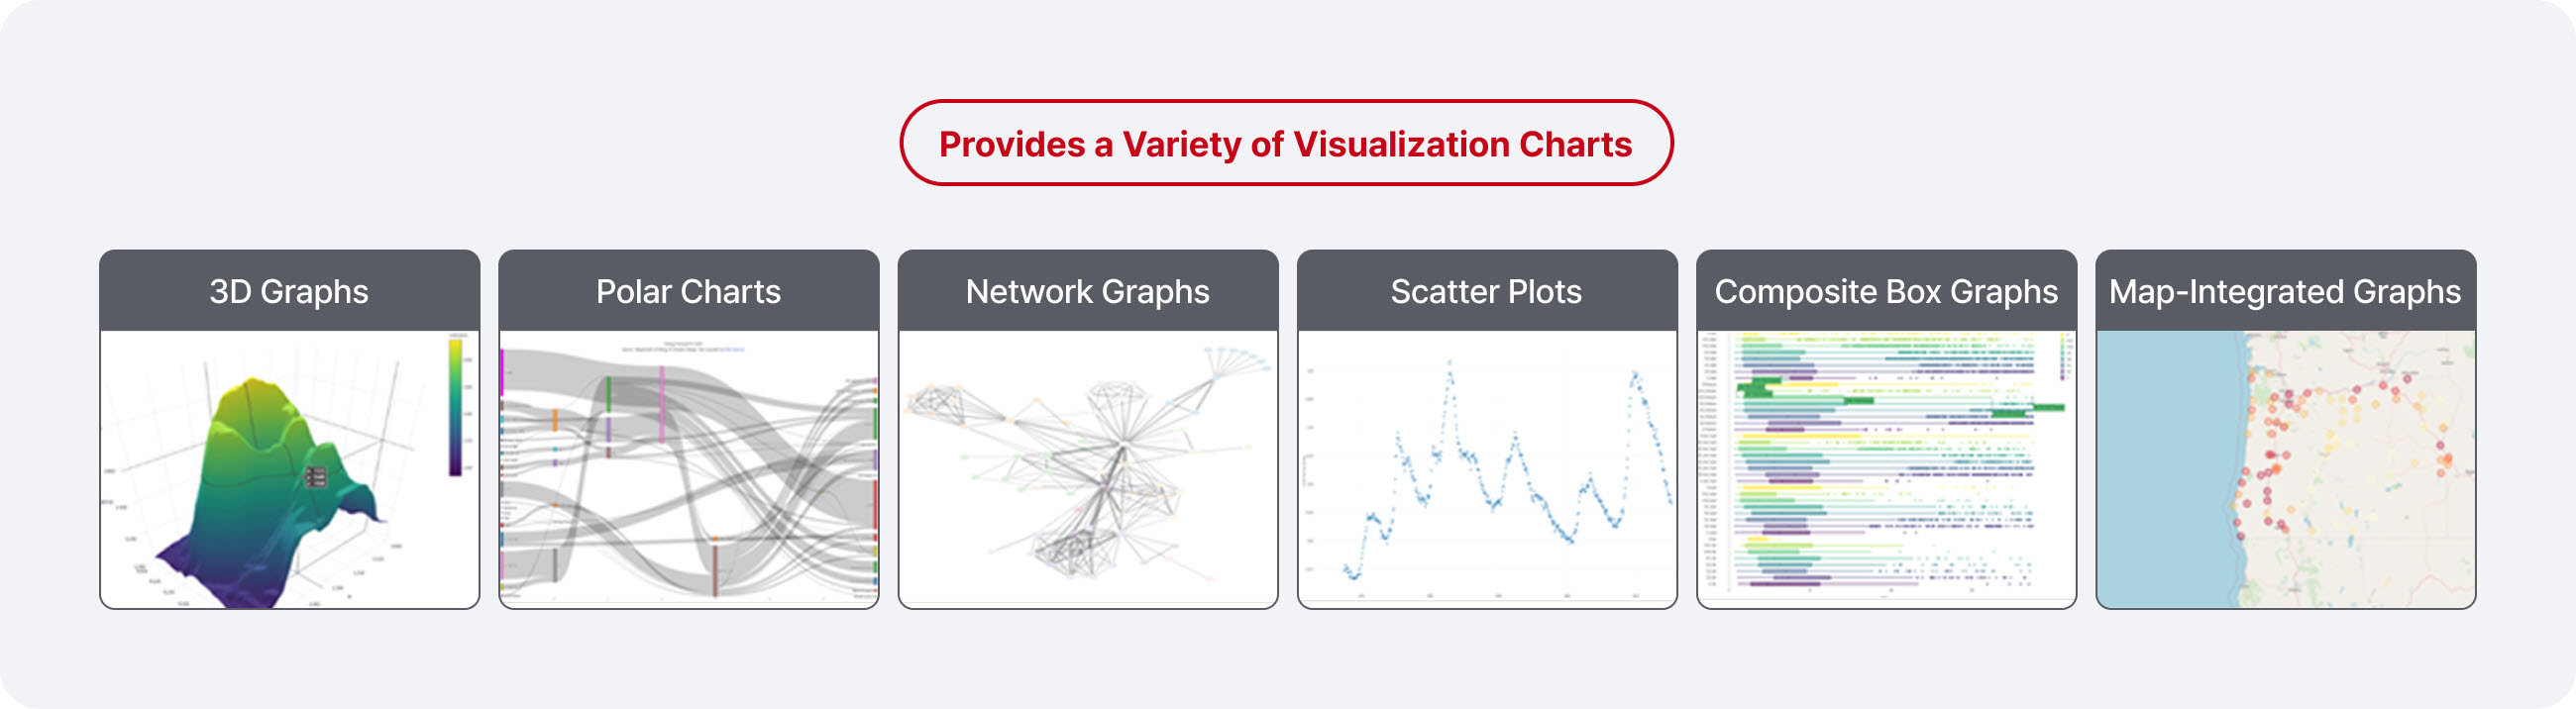
We effectively represent diverse and extensive data through a variety of charts and diagrams, offering users a clear, comprehensive view at a glance. This approach enables intuitive data interpretation, allowing users to quickly derive actionable insights.
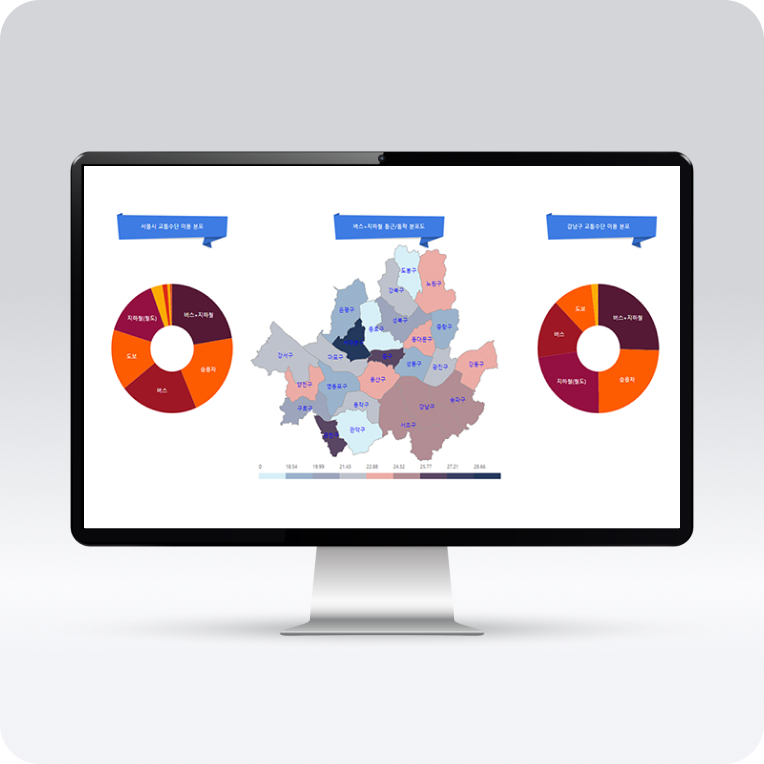
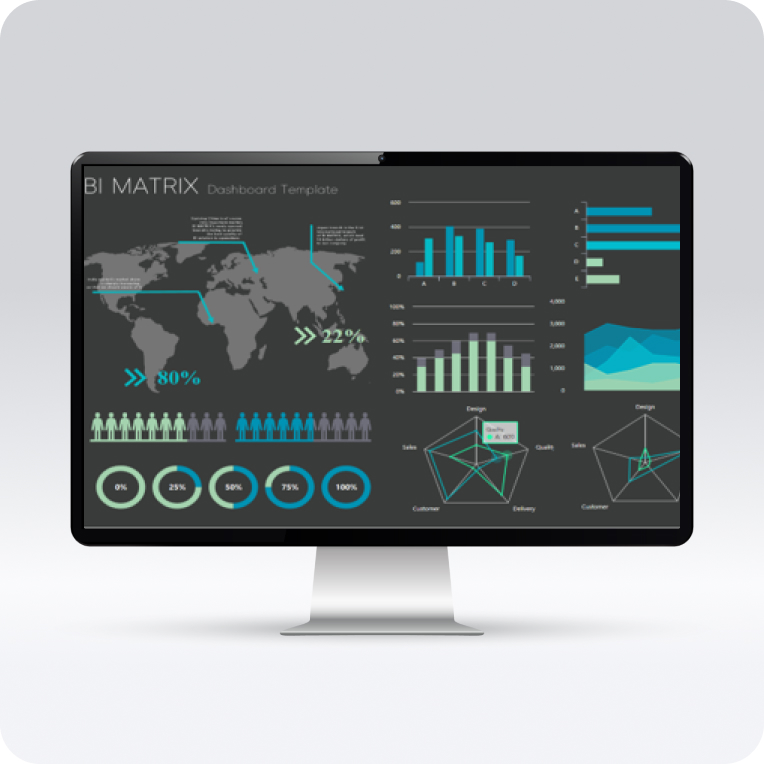
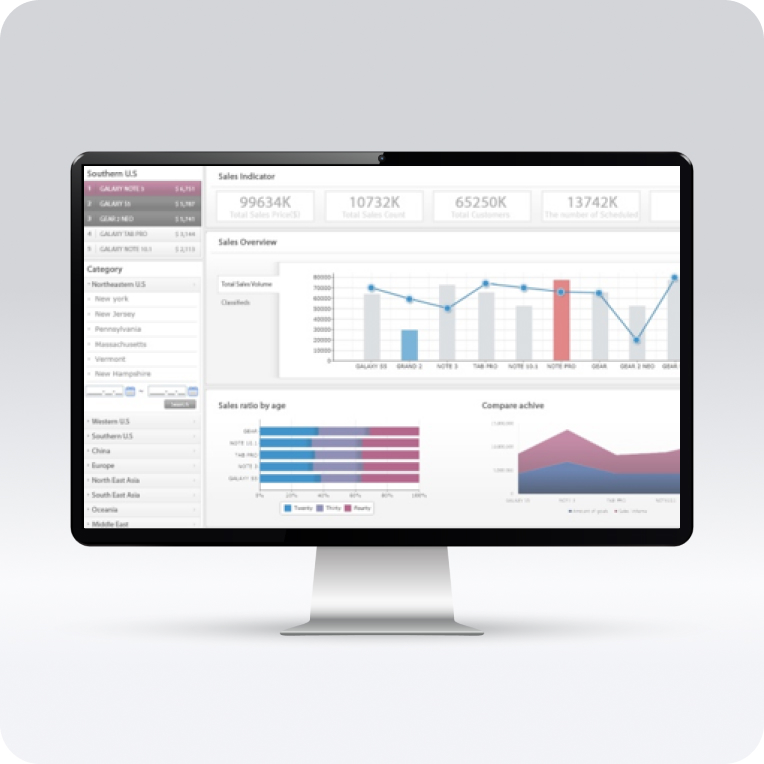
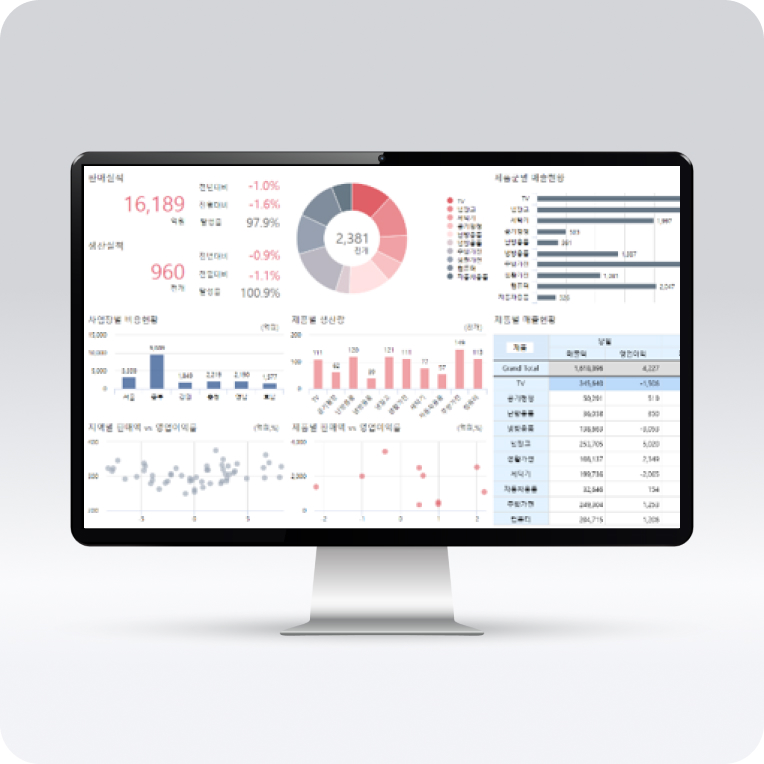
Visualization Use Case
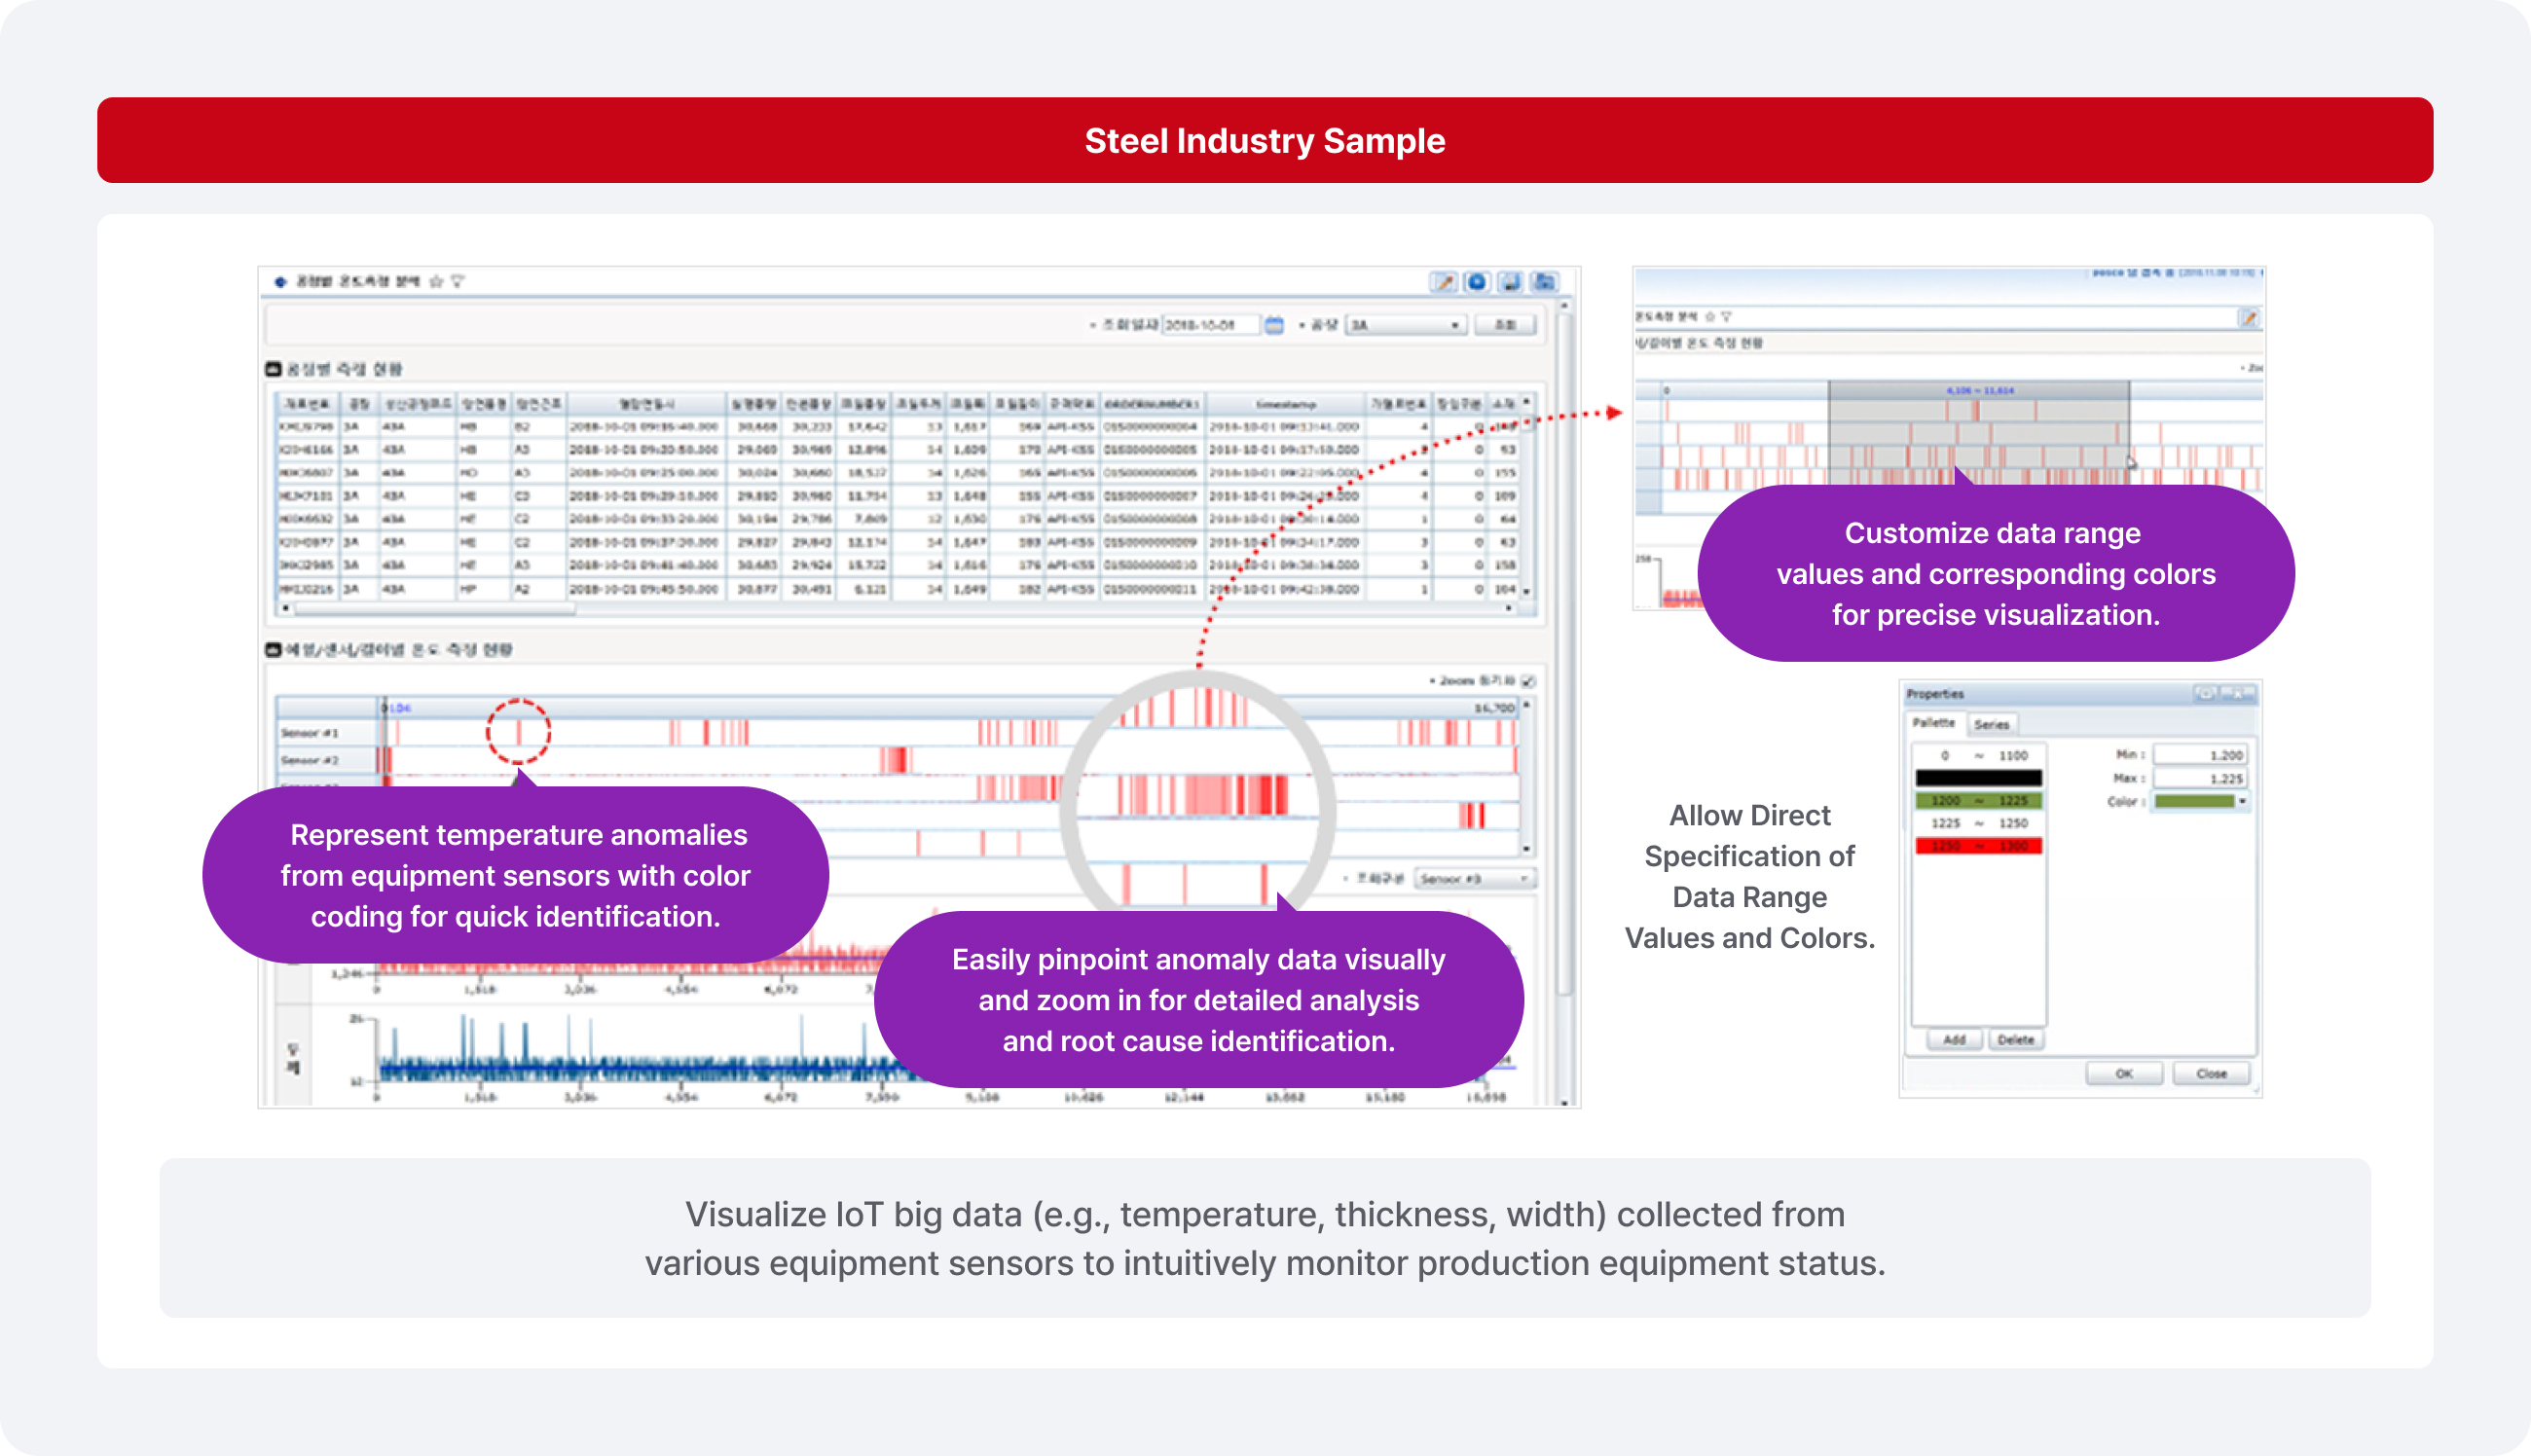
Samples

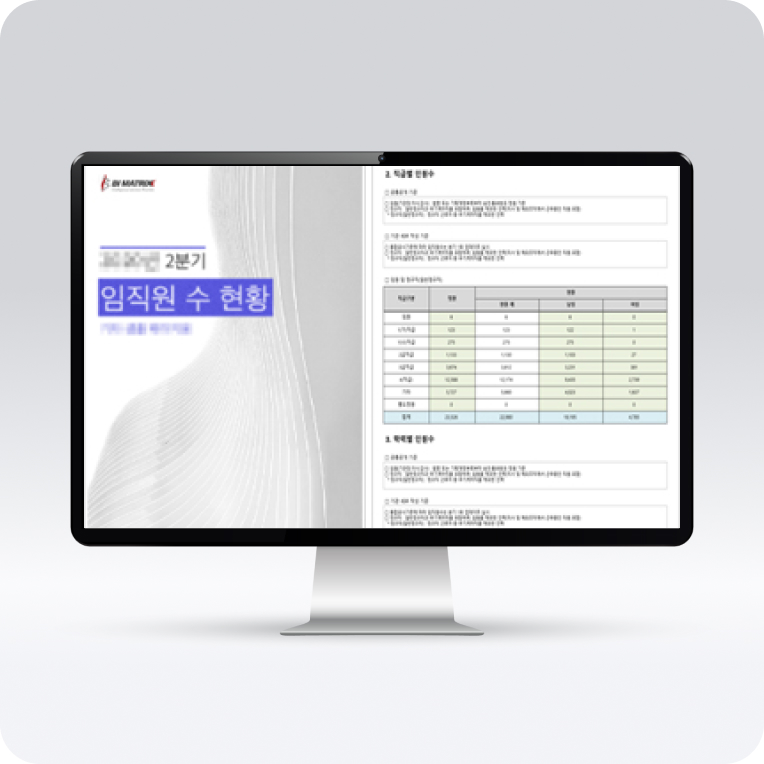
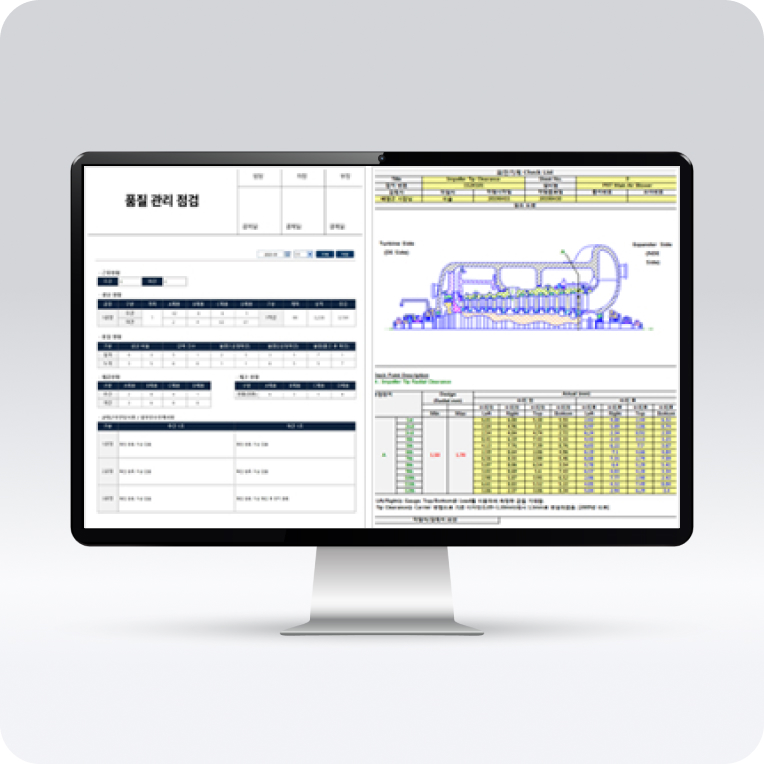
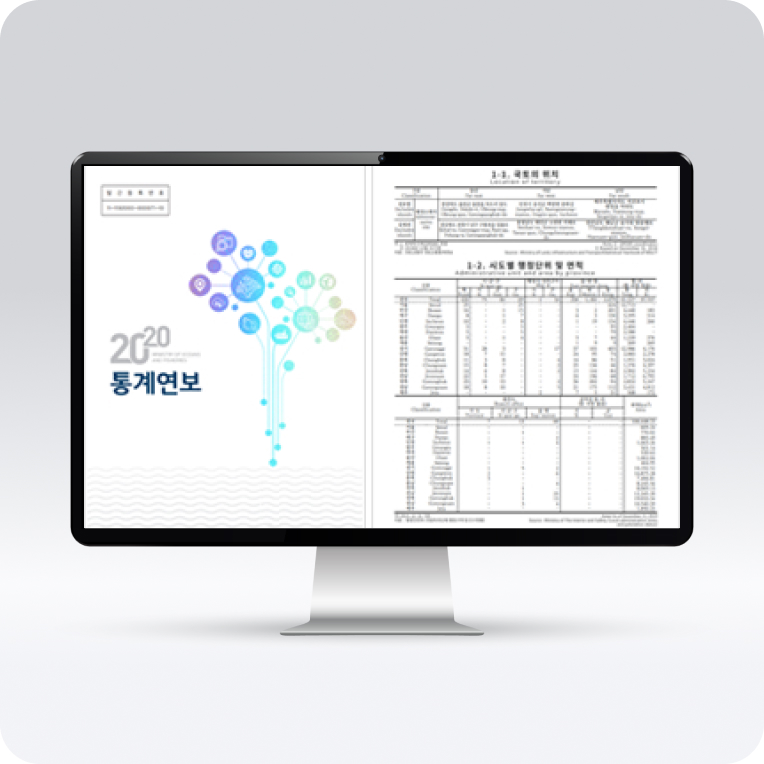
Report
Our platform enables the creation of not only simple reports but also complex, department-specific report formats and statistical yearbooks using intuitive Low-Code tools. Additionally, exporting and printing reports in formats such as PPT, Excel, and HWP can be achieved effortlessly, with no coding required.
Features
- Flexible Layout Design: Easily creates complex reports, unstructured layouts, and diverse visual formats to meet unique business needs.
- Simplified Change Management: The Low-Code development approach ensures seamless and efficient change management after implementation.
- HTML5-Based Report Generation: Supports web standards for report creation.
- Export and Print: Converts reports into various file formats and supports printing.
- Advanced Web Features: Includes functionalities like fixed headers and merged cells, which are typically challenging to implement on web screens.
- Customizable Graphs and Charts: Offers a wide range of visually appealing graphs and charts customizable to user preferences.
- Multilingual Support: Provides full support for multiple languages.
Samples
Business Reports, Work Logs, Financial External Reports, Standard Templates, and Statistical Yearbooks.
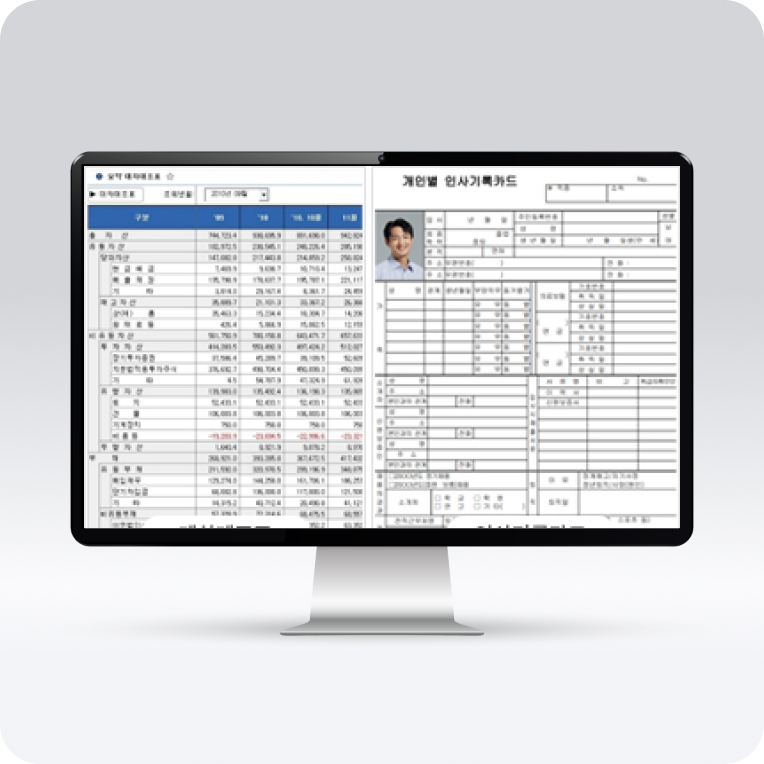
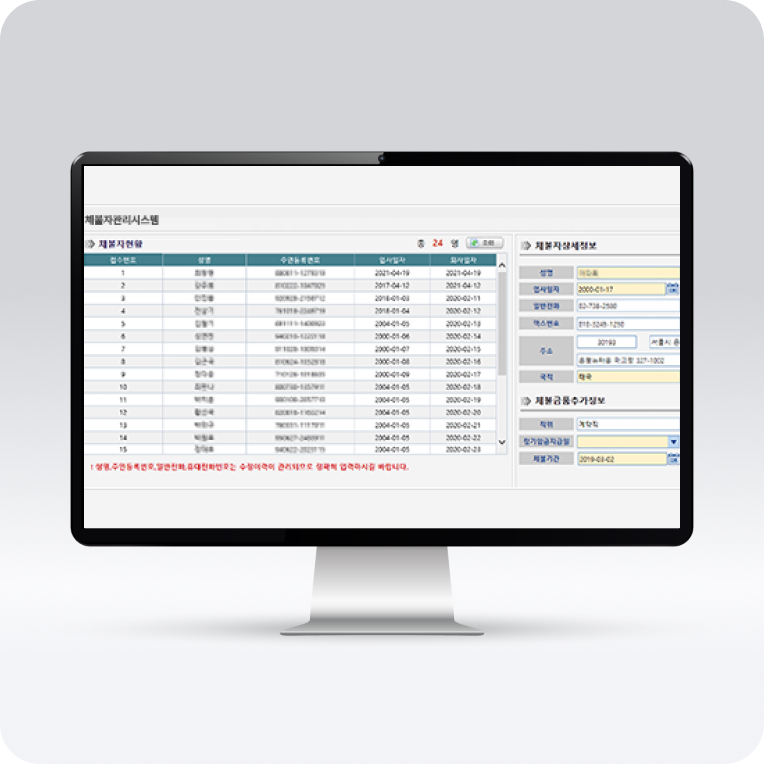
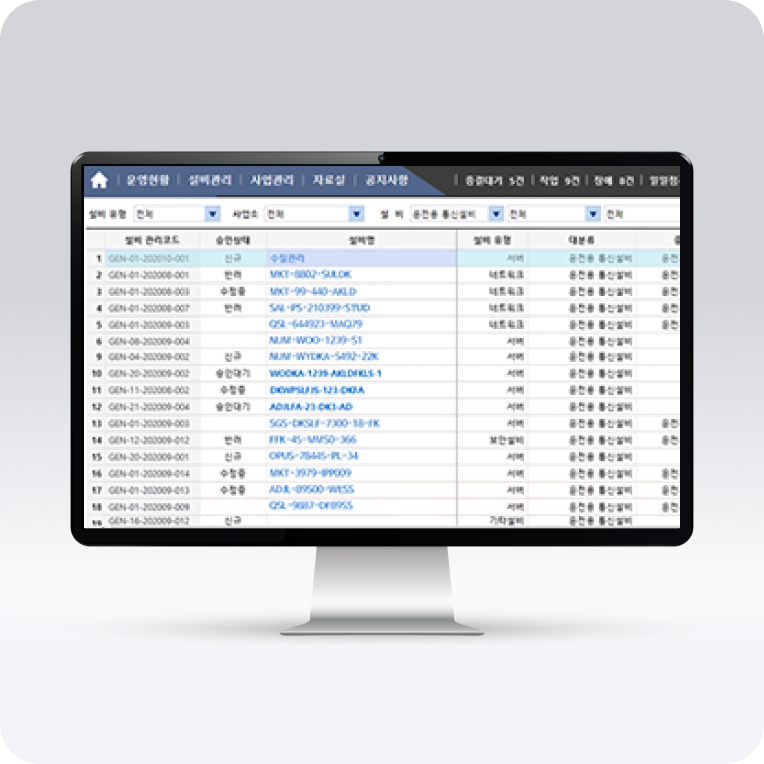
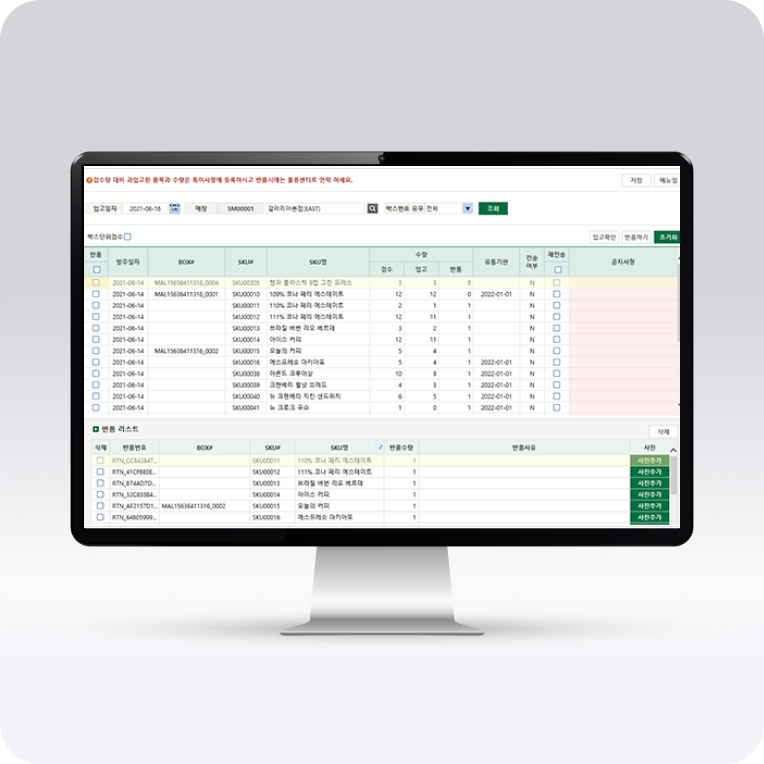
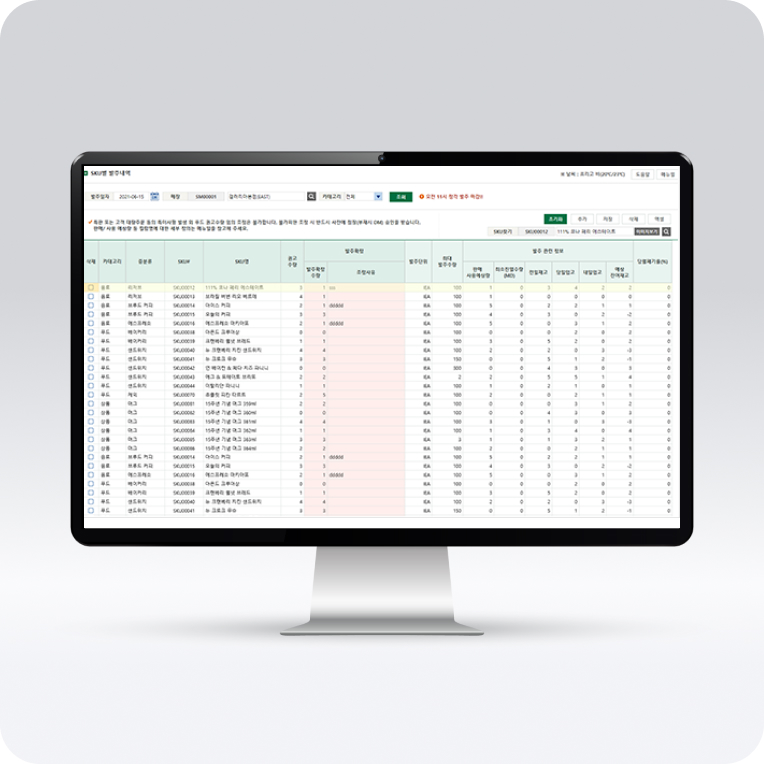
UI/UX
Our platform provides data CRUD (Create, Read, Update, Delete) functionality, essential for enterprise business systems. Leveraging a design tool powered by SW Robots (software robots) technology, even users without SQL or JAVA coding expertise can effortlessly link database data and develop user interfaces with ease.
Features
- Intuitive Screen Creation: Enables junior developers and business users to easily create screens using SW robot's coding automation features.
- Process Flow Visualization: Facilitates step-by-step or comprehensive process flow visualization for enhanced understanding and streamlined management.
- Responsive Screen Layouts: Dynamically adjusts screen layouts based on device resolution, ensuring full compatibility with mobile and other devices.
- Standardized Coding Practices: Through standardized coding practices, minimizes human errors and simplifies maintenance.
- E-Government Framework Certification: Fully certified for compatibility with the e-Government Standard Framework.
Samples
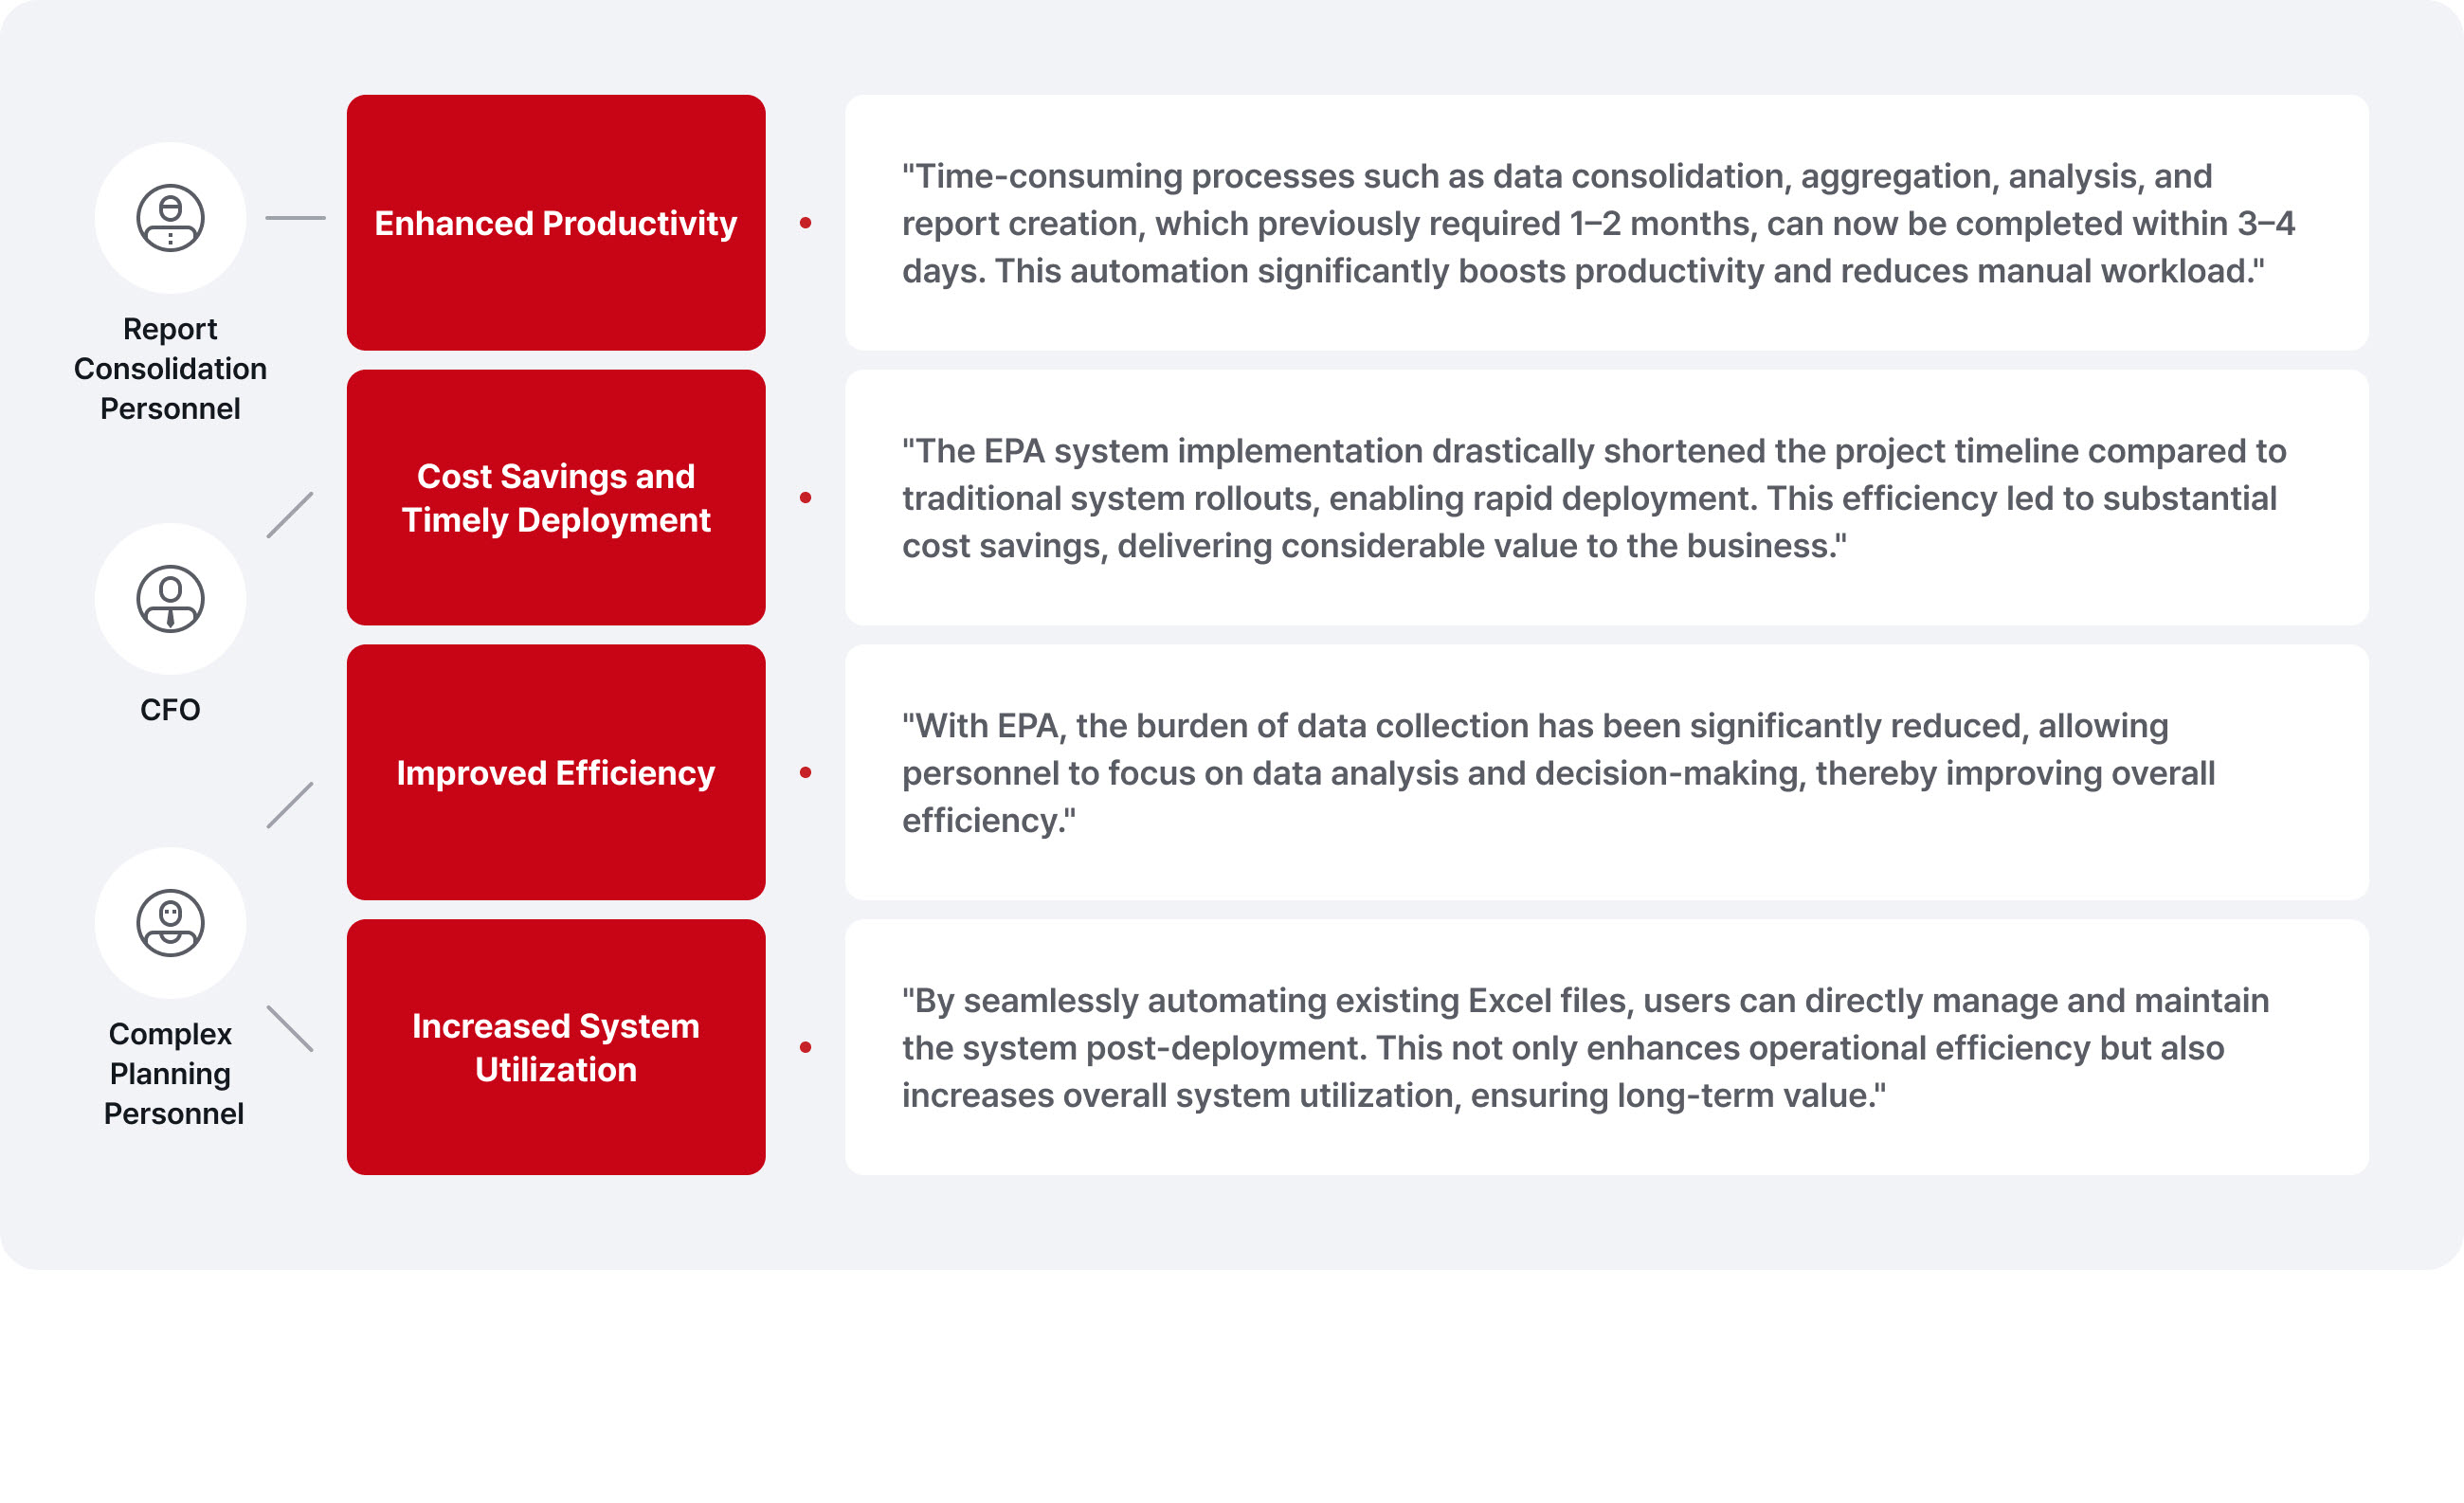
Excel Process Automation
Our EPA (Excel Process Automation) system streamlines and automates complex, Excel-based manual tasks, significantly enhancing organizational productivity and efficiency.
Features
- Automates Existing Excel Files: Automates used Excel files while retaining formulas, allowing users to adopt the EPA system without any disruption current workflows.
- No Additional Training Required: Allows users to continue working in their familiar Excel-based environment without the need for additional training.
- Streamlined Navigation of Large Excel Files: Organizes large and complex Excel files into functional and purpose-driven views, making it easier to locate and understand required information.
- Formula and Macro Management: For Excel files with complex formulas or macros, the system provides a dedicated formula management menu, allowing business users to handle formulas without requiring deep technical knowledge.
- Automated Data Consolidation and Reporting: Automates the consolidation of manually entered data into a unified report format and generates a variety of reports based on the consolidated data.
Benefits
Features
-

Multi-Screen Development on a Single Platform
Develop and manage various analyzing screens, including BI/OLAP, dashboards, reports, and UI/UX on a single integrated platform.
-
AI-Powered Coding Automation
Simplify business system interface development using AI technologies like SW robots and Copilot, eliminating complex programming processes.
-
Efficient System Development
Achieve effective and streamlined system development with BI MATRIX’s proprietary PPDM methodology, designed to optimize the development process.
-
Intuitive and User-Friendly Design
An easy-to-use interface enables users to easily develop and maintain systems.
-
Standardized Code
Minimize human errors and streamline maintenance with standardized code powered by SW robots.
-
Data Mining and AI
Unlock powerful analytical capabilities by integrating advanced Data Mining and AI technologies into your business systems.
-
Powerful Visualization Analytics
Deliver powerful visualization analytics to enhance data insights.
-
Support for Heterogeneous Database Environments
Utilize Hadoop and various database sources, supporting multiple database connections on a single screen.
-
Comprehensive Security and Access Control
Implement strong security measures and access control features to regulate DB access and data extraction, including data masking based on user permissions.


Business System Implementation Benefits
-
For Executives/Managers
- Gain a comprehensive perspective on the company’s status.
- Enable rapid decision-making by accessing critical data in a timely manner.
- Strengthen management information analysis capabilities.
-
For Business Users
- Improve work efficiency through the automation (systemization) of manual tasks.
- Develop required business screens and perform data analysis directly, without relying on IT staff.
- Easily adapt to changing business requirements and respond quickly to new demands.
-
For IT Personnel
- Enhance data accuracy and reliability through integrated data management.
- Secure high-performance analytical systems.
- Establish a foundation for systematic data management.
- Implement an effective access control system for data and reports.


PPDM Development Methodology
By applying BI MATRIX's proprietary PPDM (PPalli PPalli Development Methodology) methodology, business systems can be built efficiently and in the shortest time.
Background
Overview
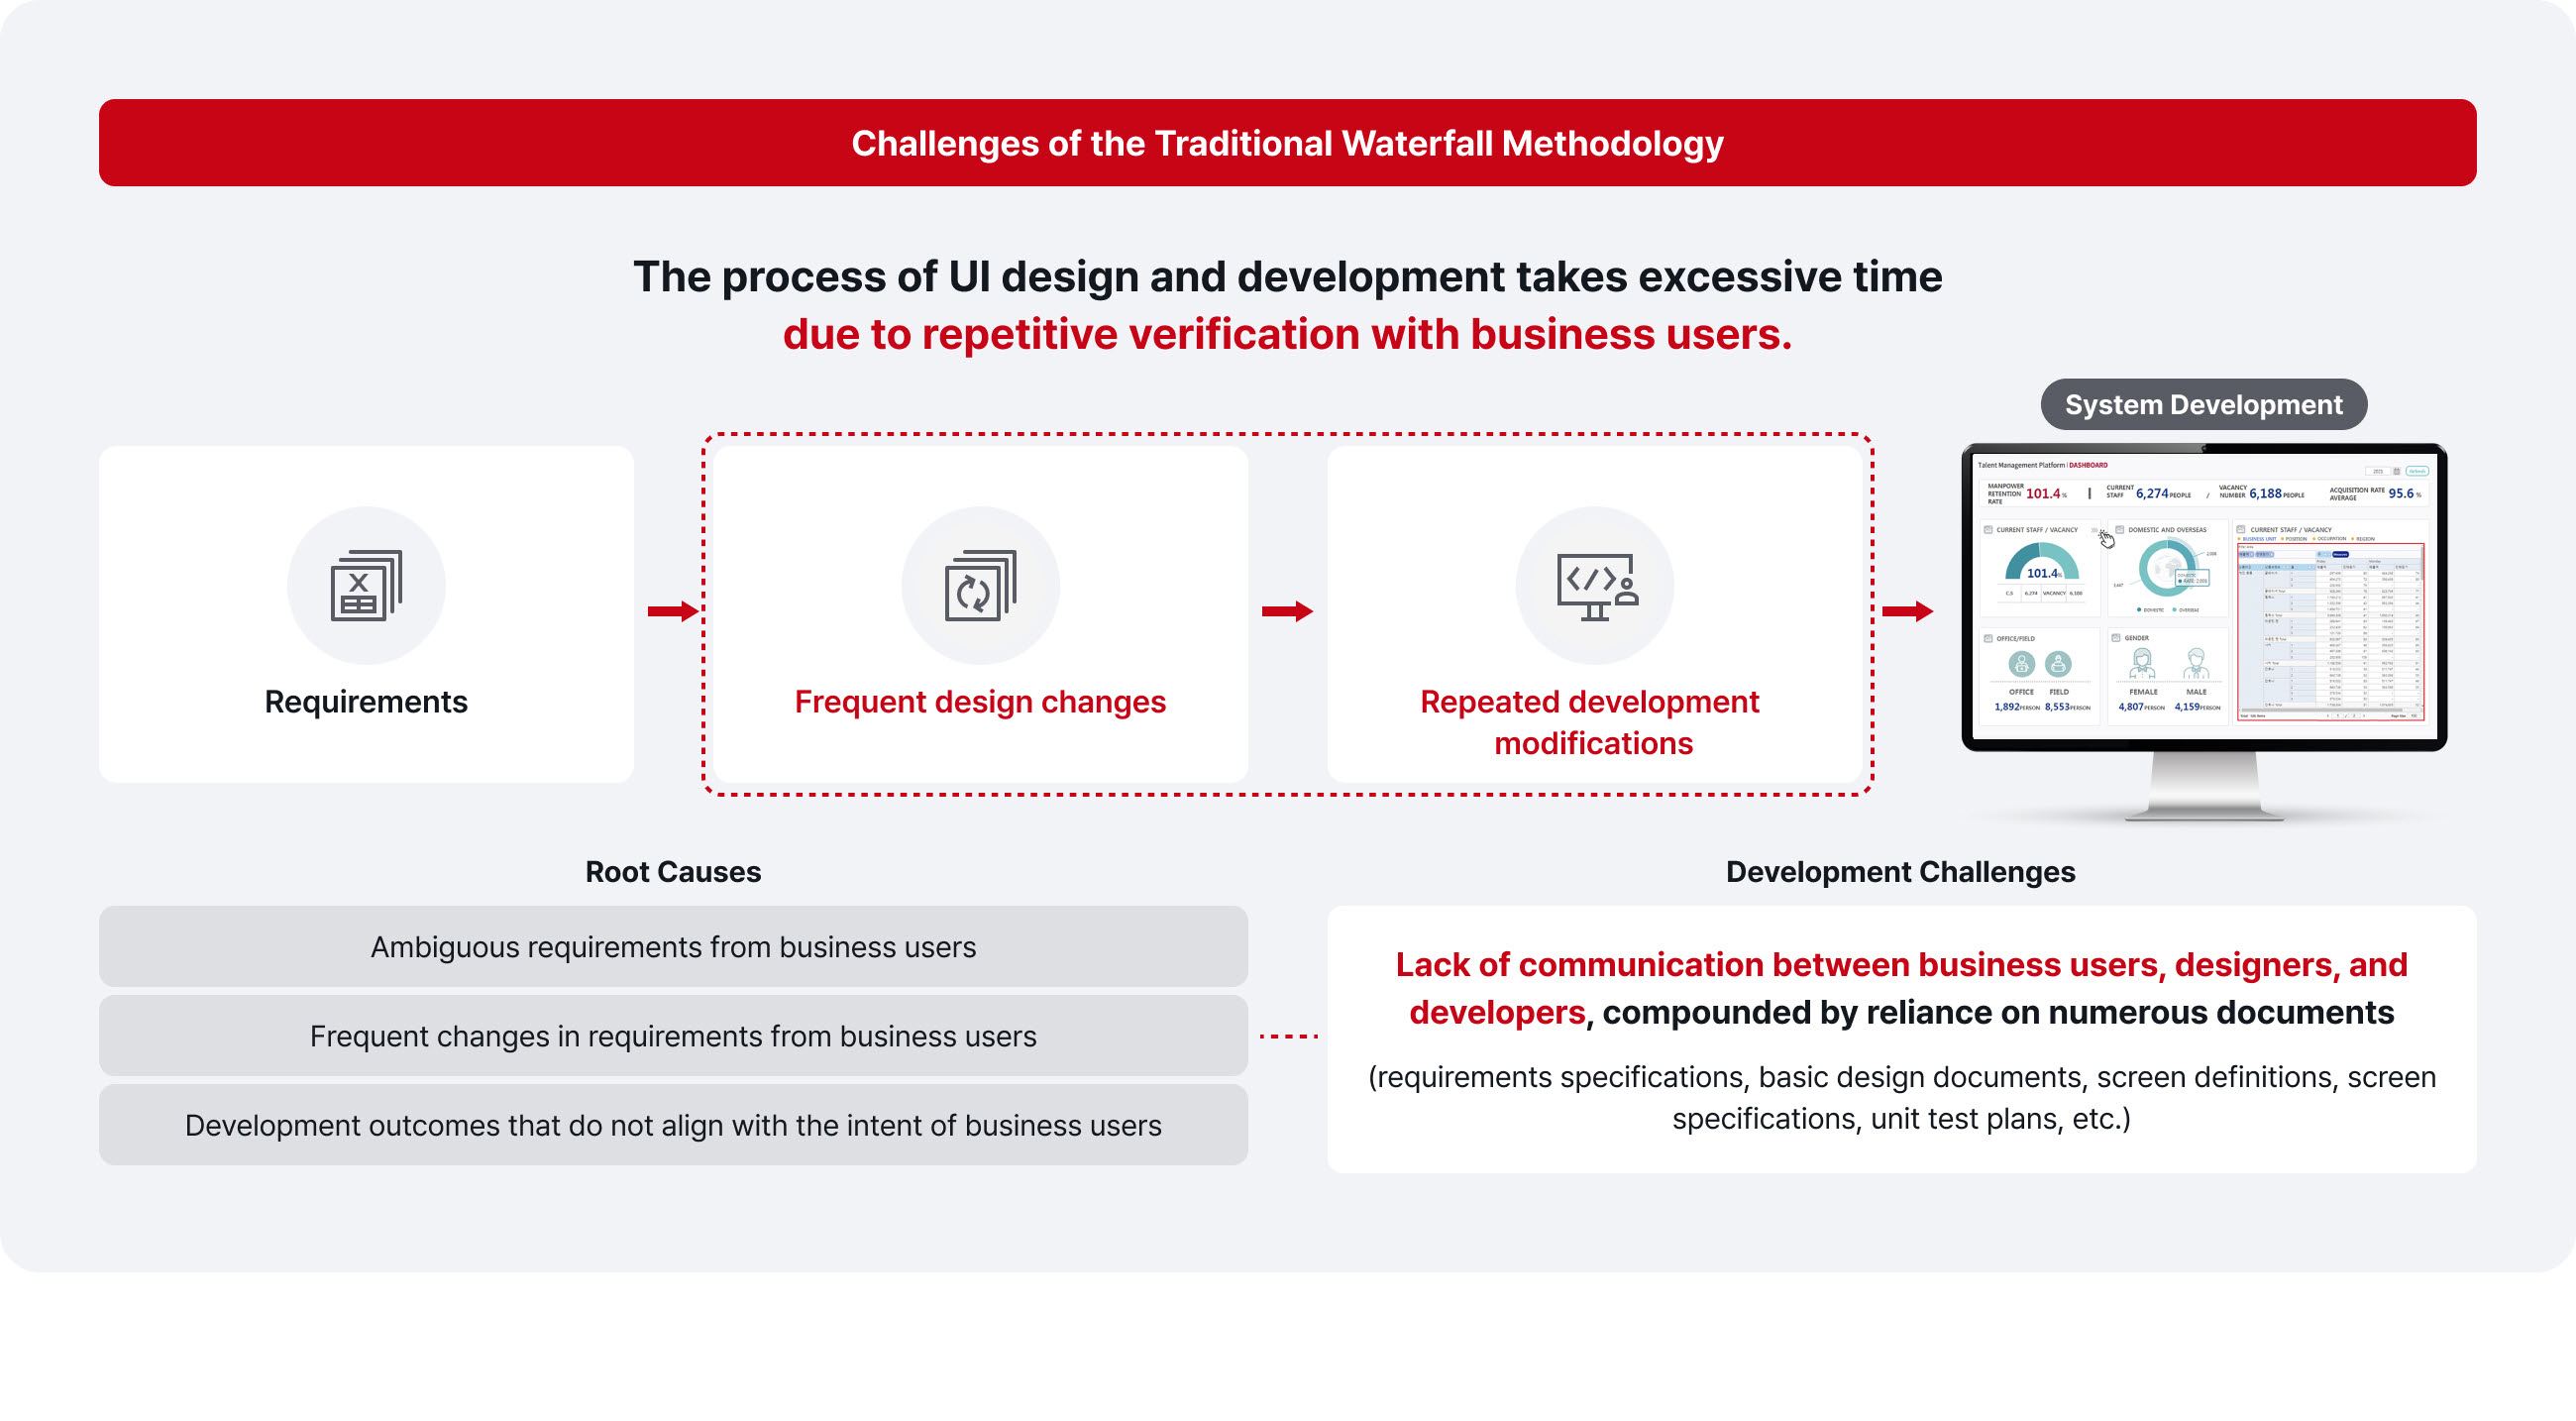
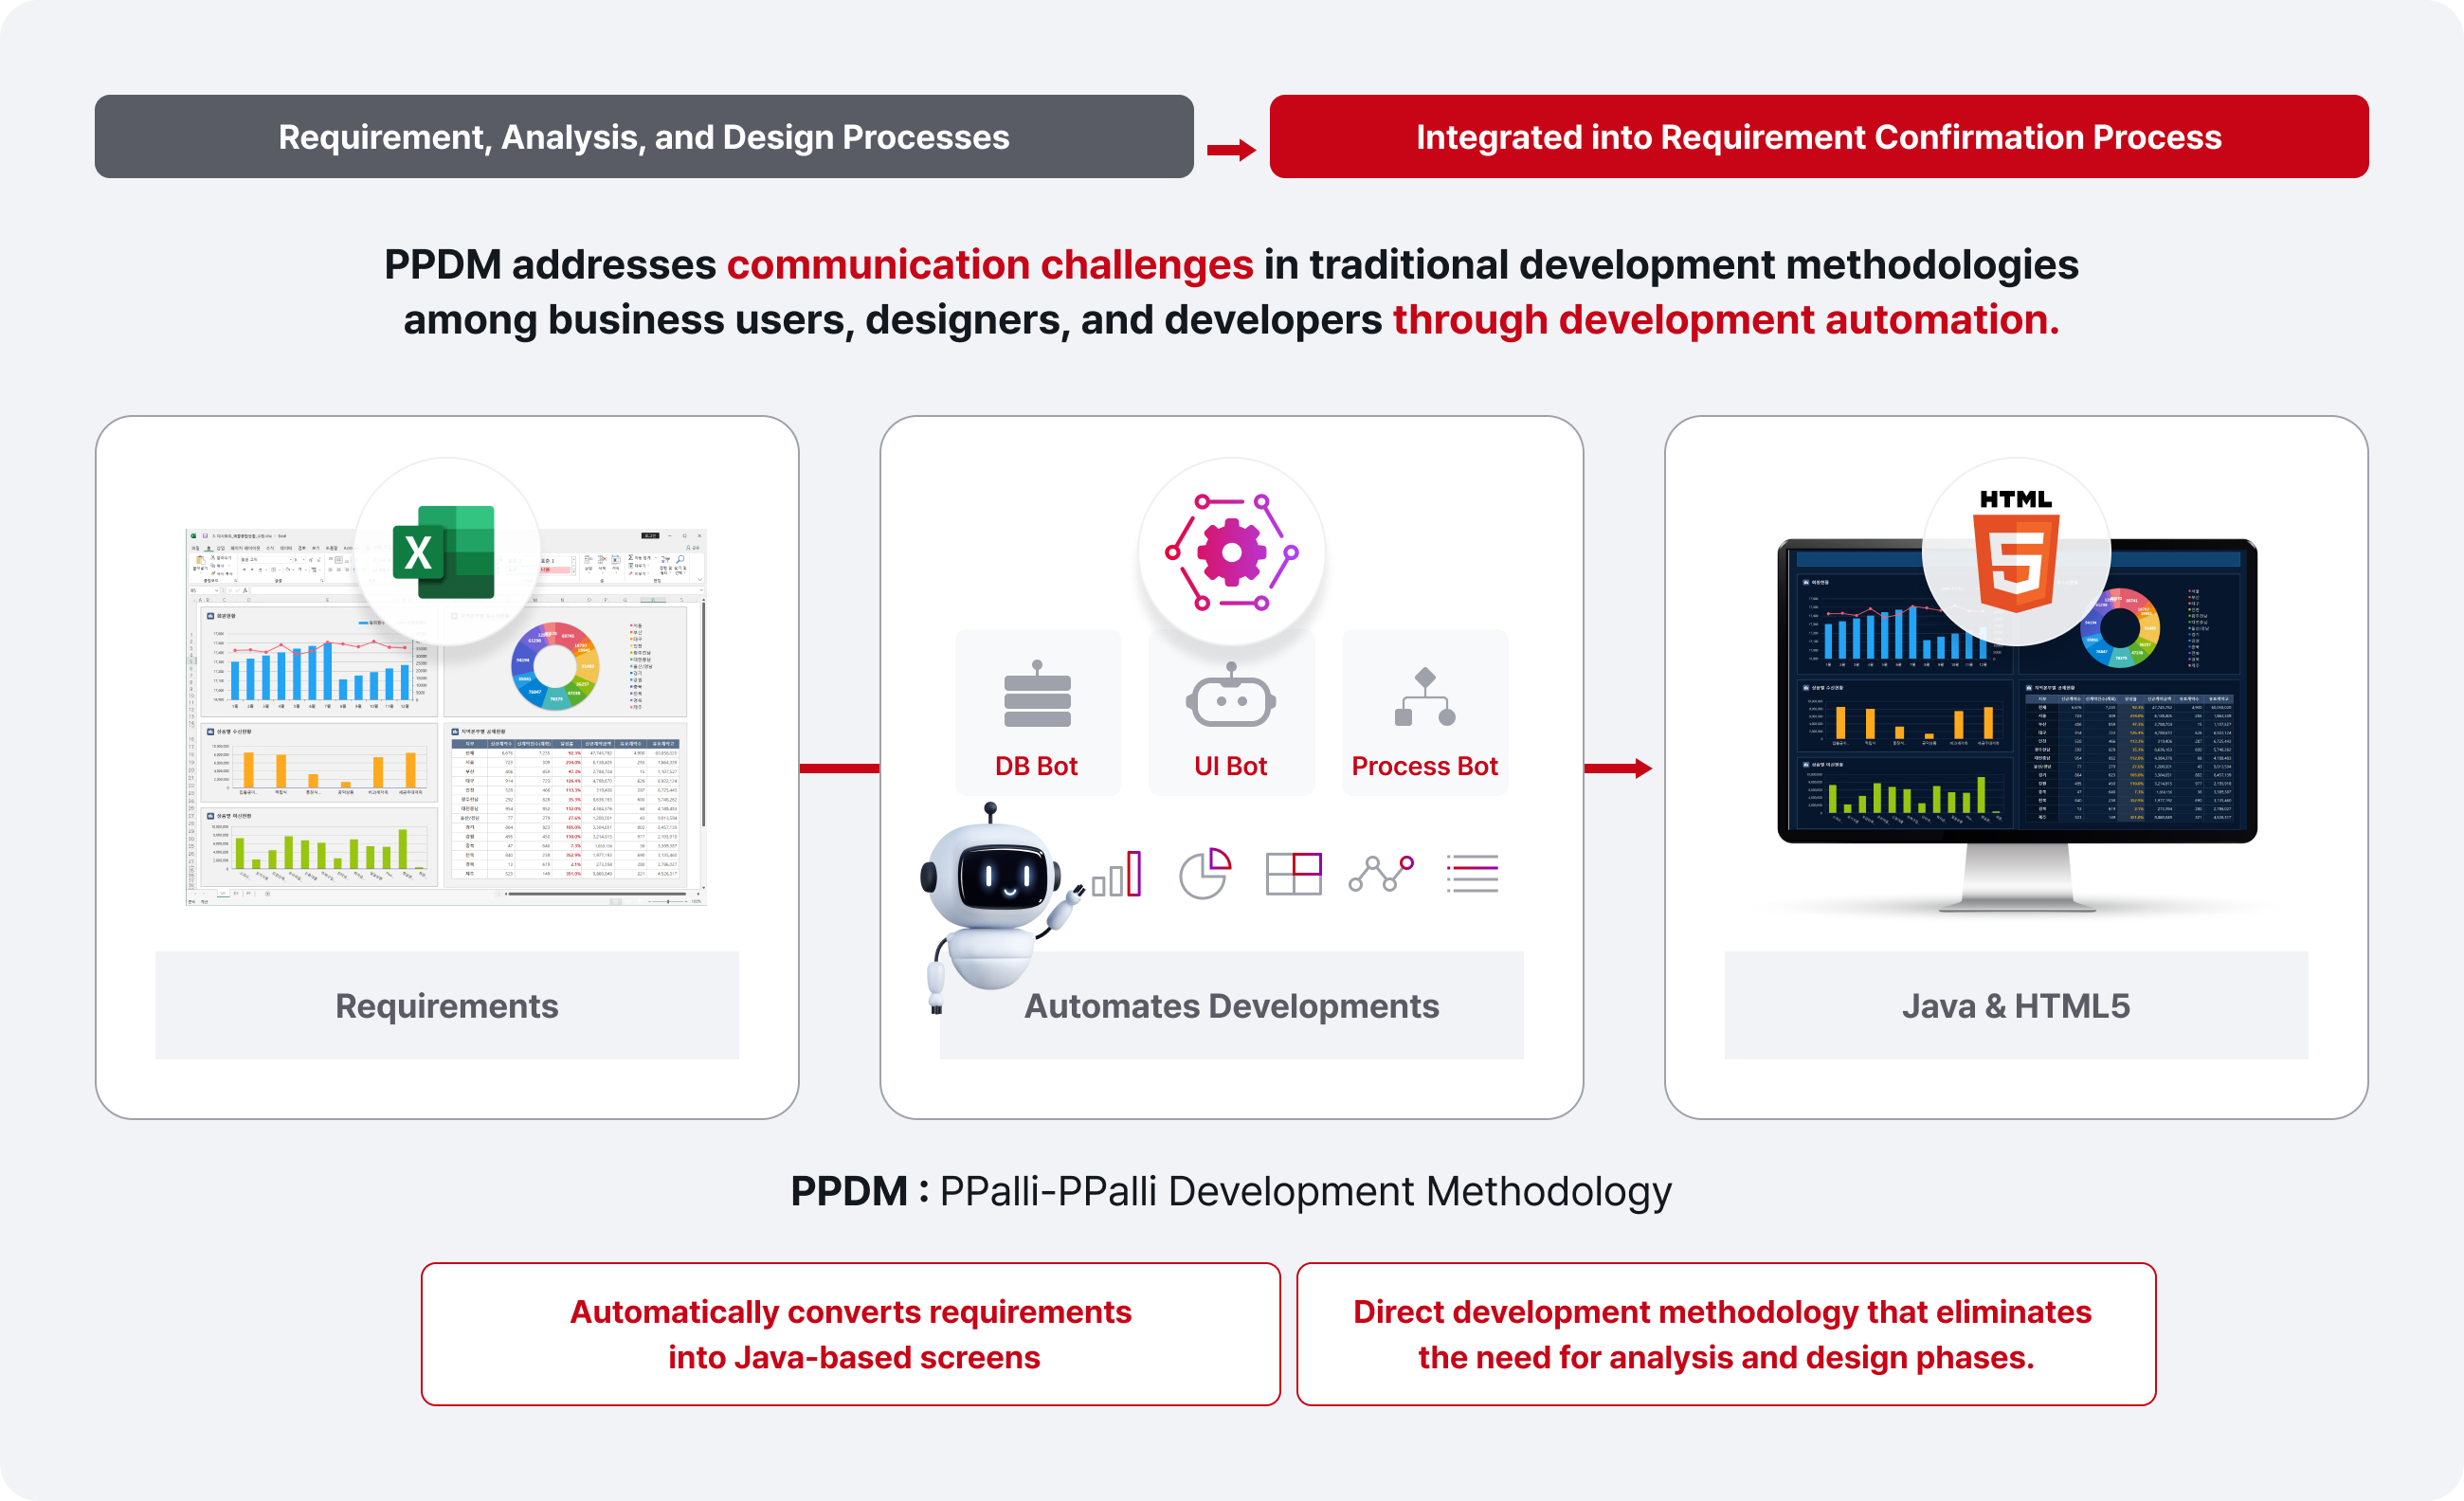
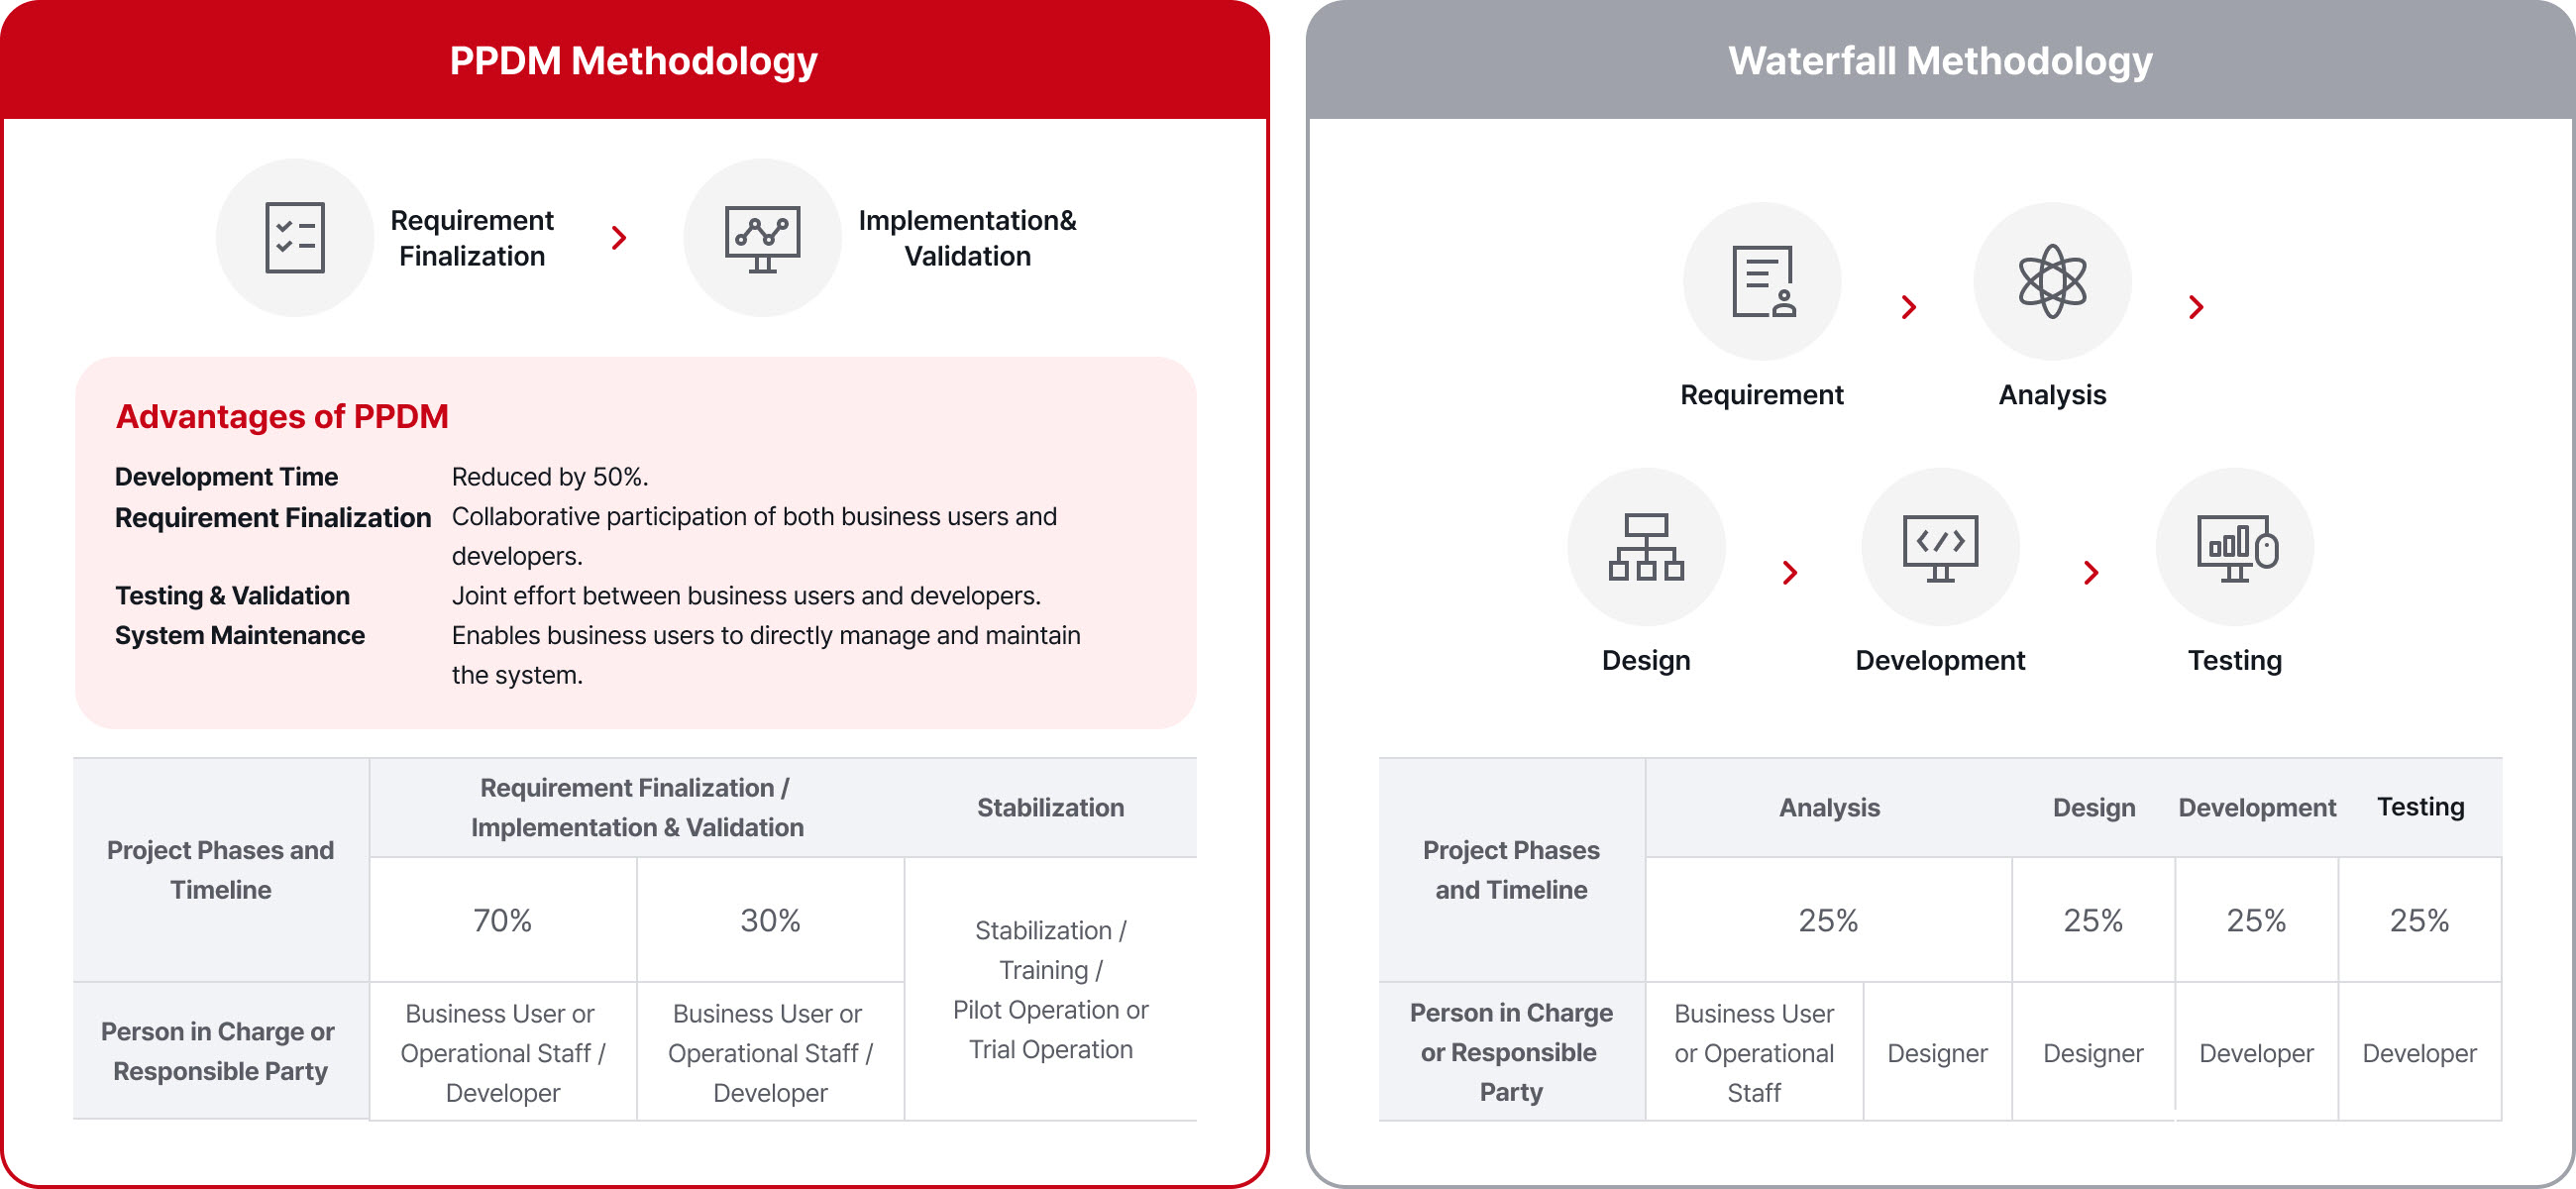
PPDM is BI MATRIX’s proprietary development methodology designed to significantly reduce the Front-End UI development time for business systems. By bypassing the analysis and design phases, PPDM allows direct development based on finalized requirements.
Comparison of PPDM vs. Waterfall Development Methodology
Four Development Techniques of the PPDM Methodology
TBD (Template-Based Development)
- Develop screens by following a step-by-step approach based on predefined templates or samples. (Forward Direction Development)
EPA (Excel Process Automation)
- Develop requirements using Excel and connect the data later in the process. (Type: Reverse Direction Development)
Derived Method
- Transform data into UI screens by progressively modifying the data. (A key technique in Low-code/No-code development)
Reverse Method
- Begin development with the screen and connect the data afterward.
- In cases where real data is unavailable, generate and use virtual data for development.
Samples
Related Solutions
-
AUD Platform
VIEW MORE