i-CANVAS
A Tailored BI Solution for Public Institutions to Create Sophisticated EIS/Dashboard Screens Easily and Quickly
- Self-BI
- DashboardCreationLikeCanvasDrawing
- ComprehensiveOverviewAndDetailedAnalysis


i-CANVAS is a BI solution specifically designed for public institutions, enabling users to effortlessly and swiftly create EIS and dashboard.
It offers powerful tools for connecting to databases, generating reports, editing, modifying, sharing, and distributing data in a web-based environment. With integrated features for diverse status analysis, correlation analysis, and detailed data examination, i-CANVAS empowers users to directly access the data they need and design various types of dashboards with ease.
Functions
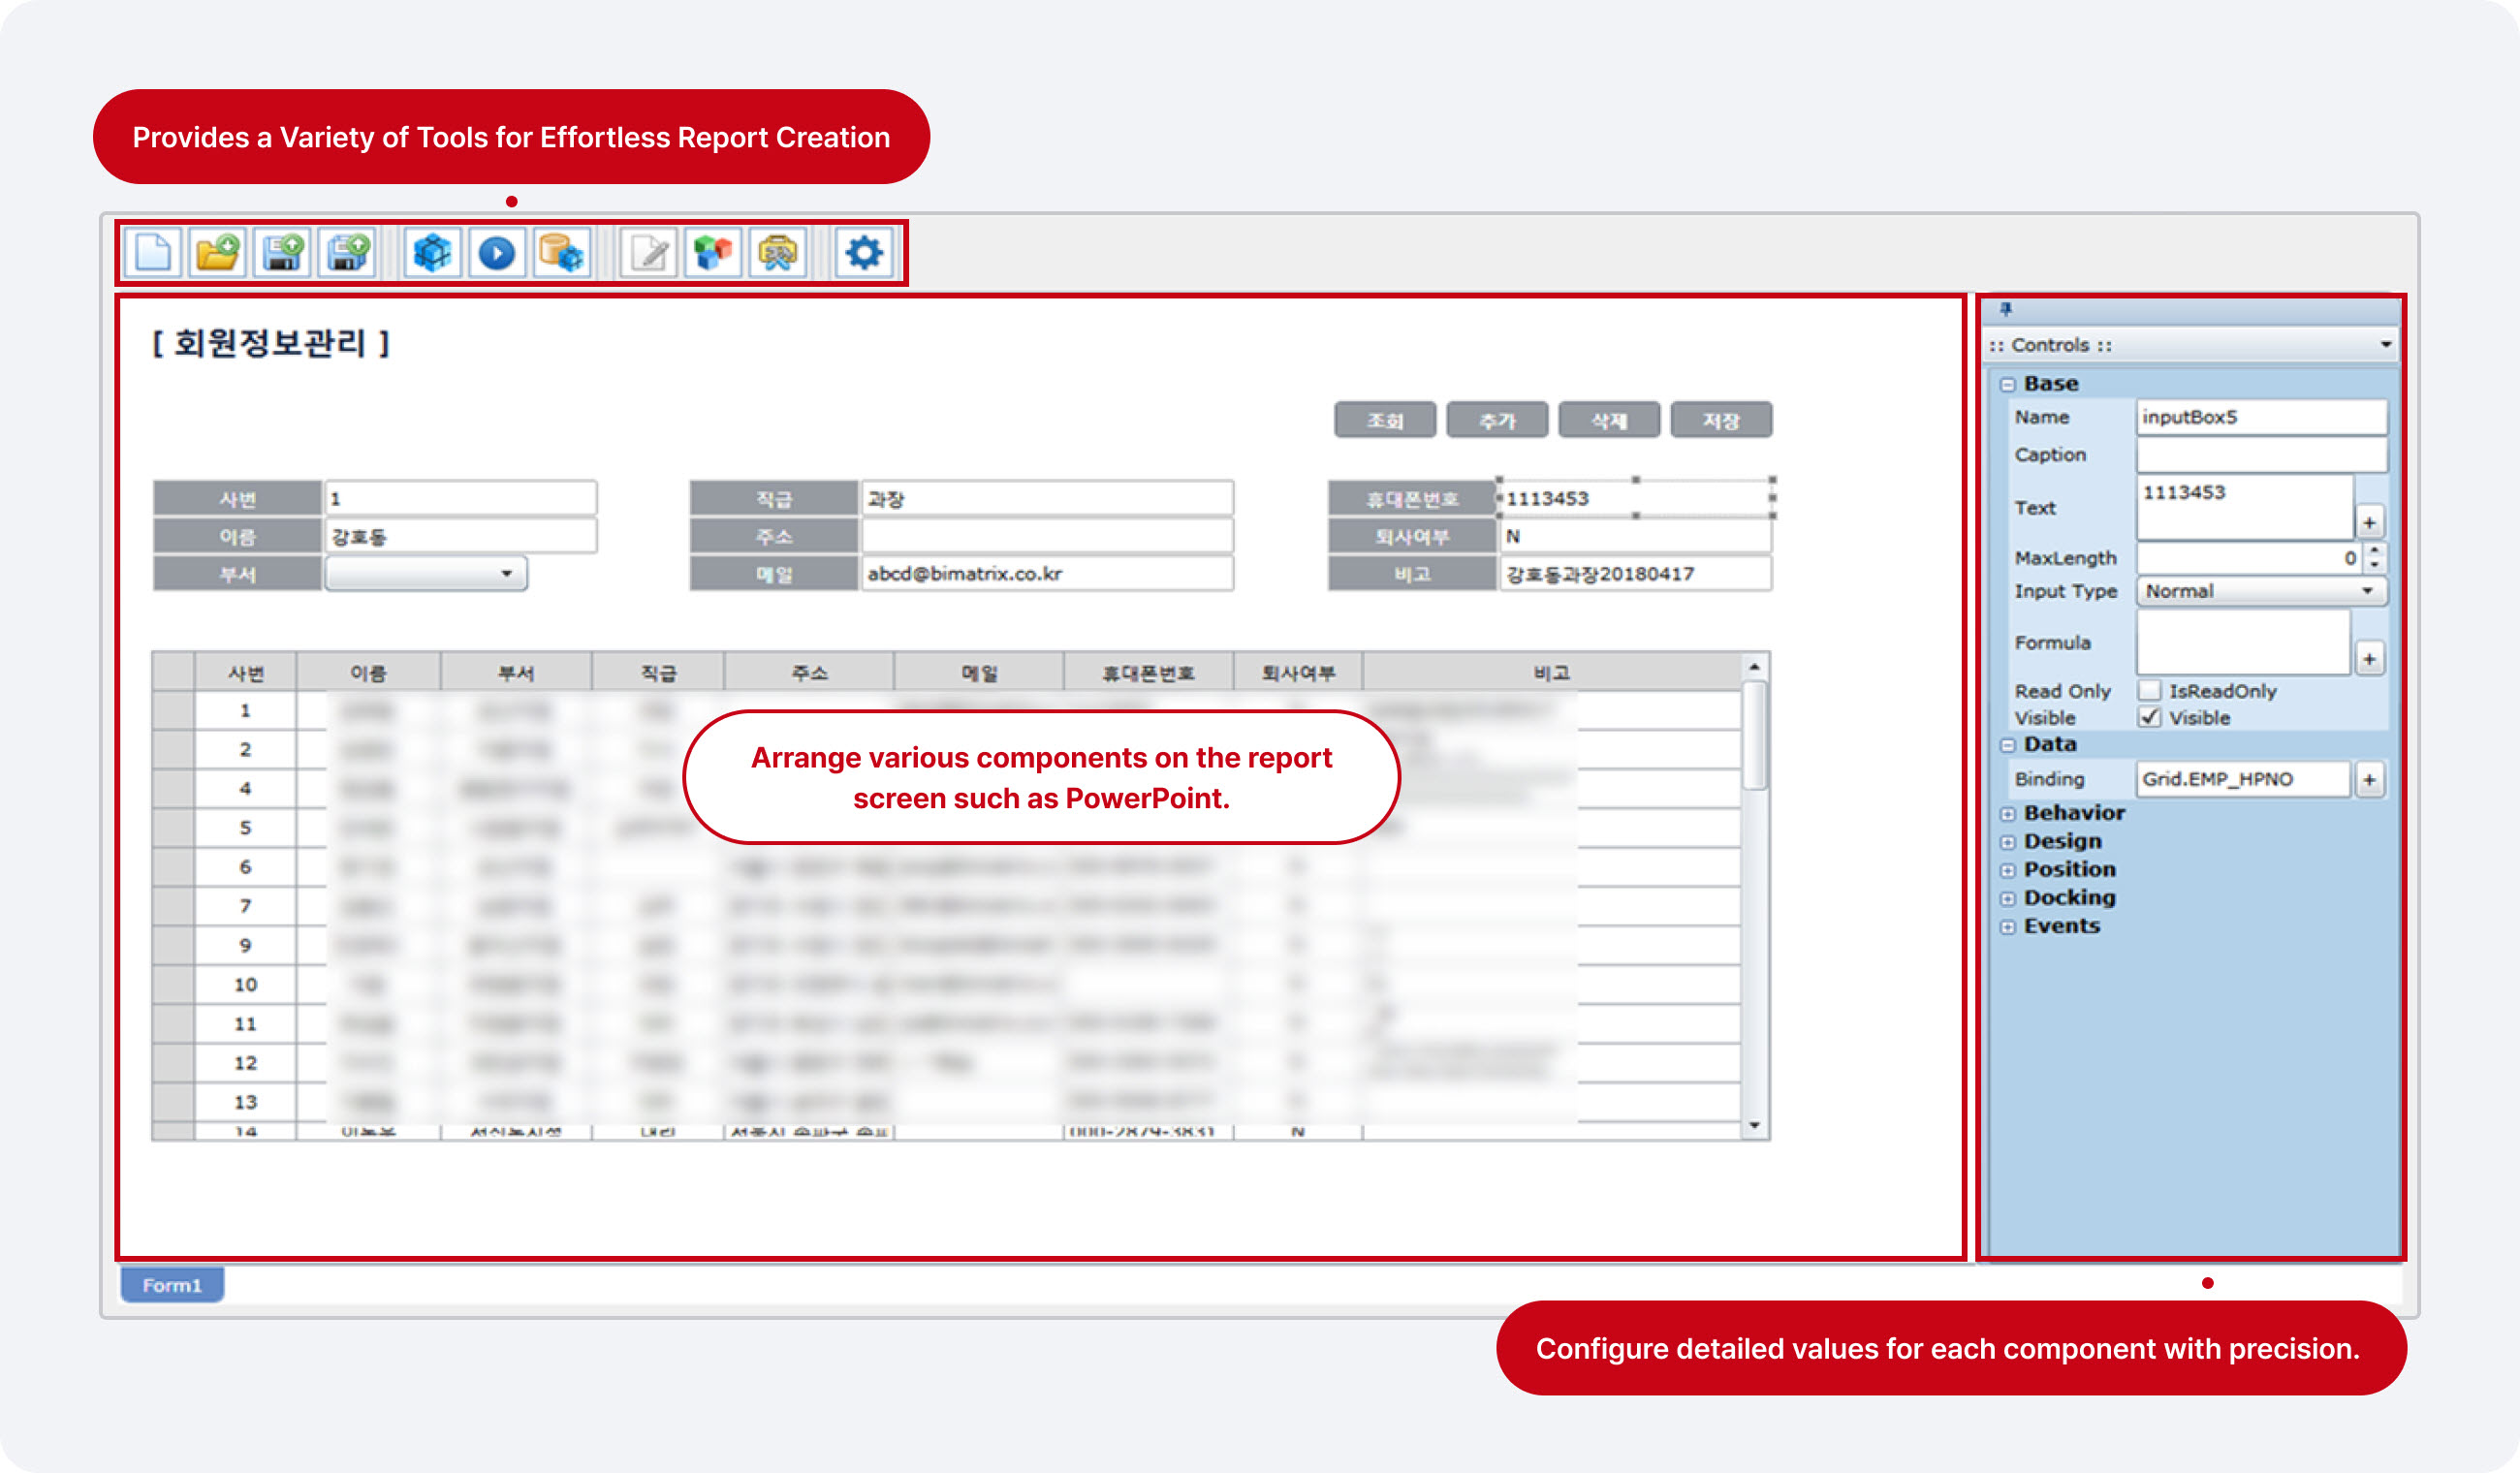
Intuitive Analytics with Enhanced Visual Design and User Experience
- Offers various components such as charts, buttons, and images for creating visually appealing reports.
- Provides diverse visualization charts, including D3, for intuitive data analysis.
- Includes dynamic charts to reflect real-time changes in data seamlessly.
Versatile Layout Configurations for Analytical Purposes
- Enables flexible layouts and information representation tailored to specific analytical goals.
- Supports flexible placement of lists, pivot grids, charts, and graphs
- Allows the integration of multiple contents into a single dashboard using tab and popup configurations.
Advanced Analytical Capabilities
- Provides critical insights through correlation and detailed analysis.
- Facilitates interactive multidimensional analysis for deeper exploration.
- Provides a scenario-based analysis environment to comprehensively examine current statuses and risk factors.
Features
SIMPLE
- Offers user-friendly and intuitive UI tools for seamless navigation
- Extract data required for analysis effortlessly with auto-generation of SELECT SQL using simple mouse clicks.
- Automate various actions with mouse clicks for report, eliminating the need for coding.
SPEEDY
- Enables rapid data analysis through a robust Big Data analytics engine.
- Provides templates for quick and visually appealing report creation.
- Simplifies and accelerates the creation of complex CRUD reports.
SMART
- Adheres to HTML5 standards, ensuring a No-Plugin work environment and support for various browsers.
- Facilitates the creation of analysis reports utilizing diverse datasets, offering a powerful reporting tool without format limitations.
- Delivers robust and systematic security and access control to align with client security policies.
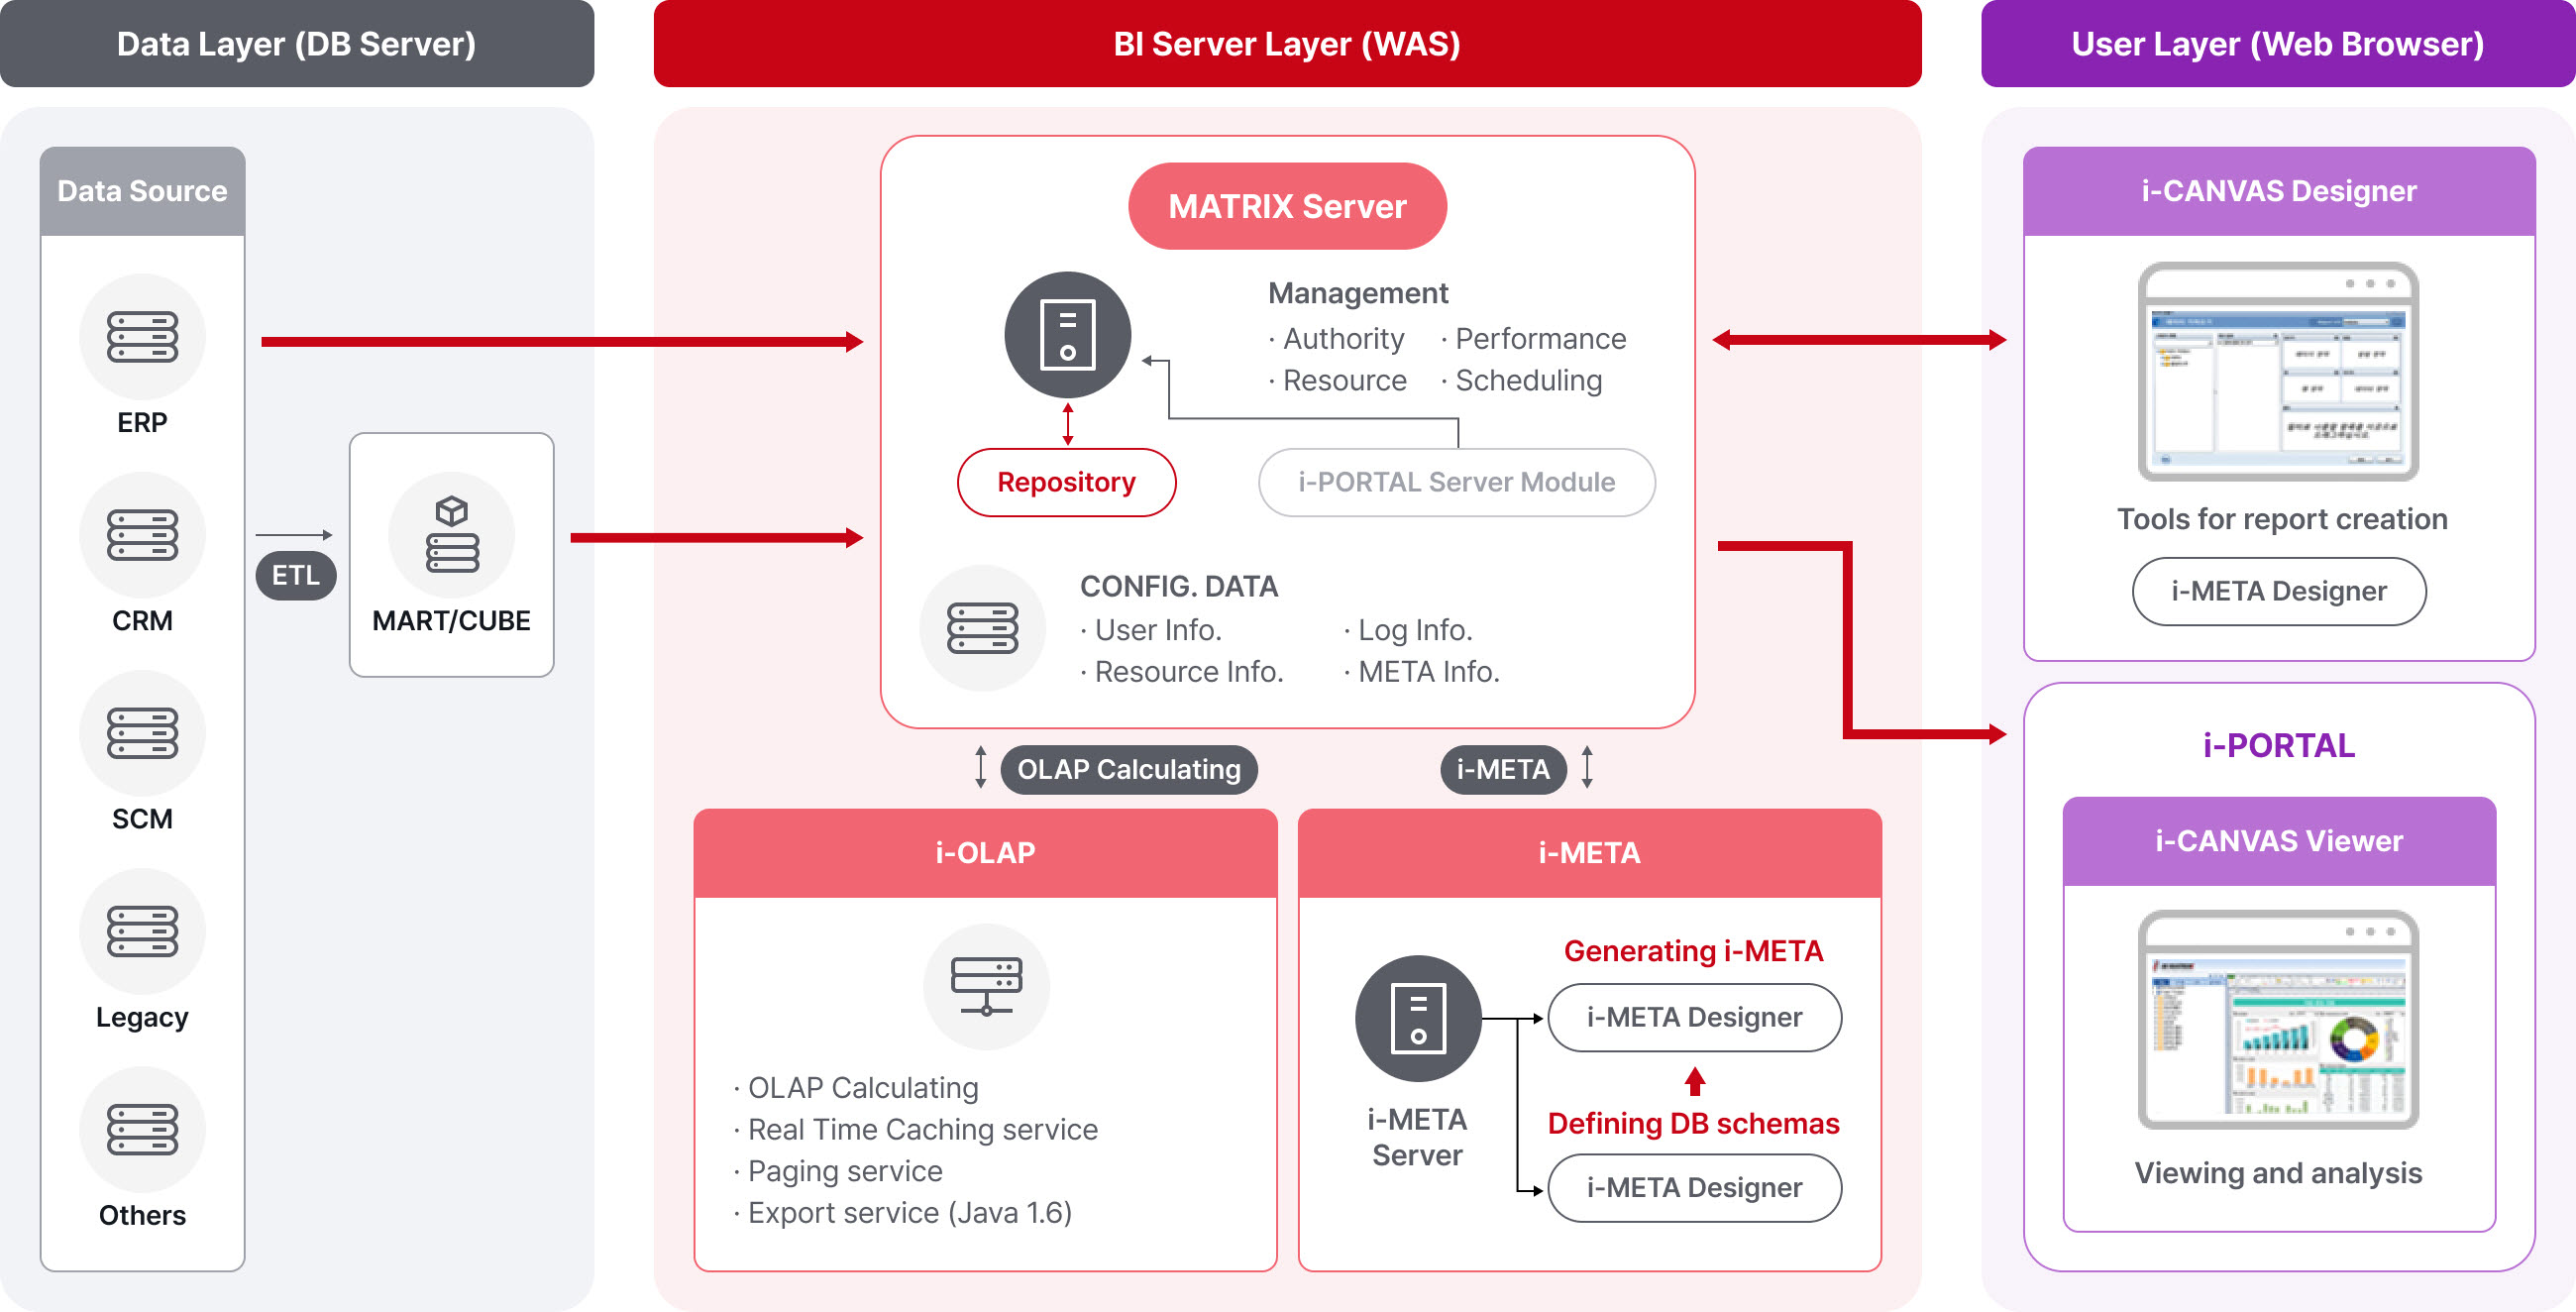
Architecture
Architecture
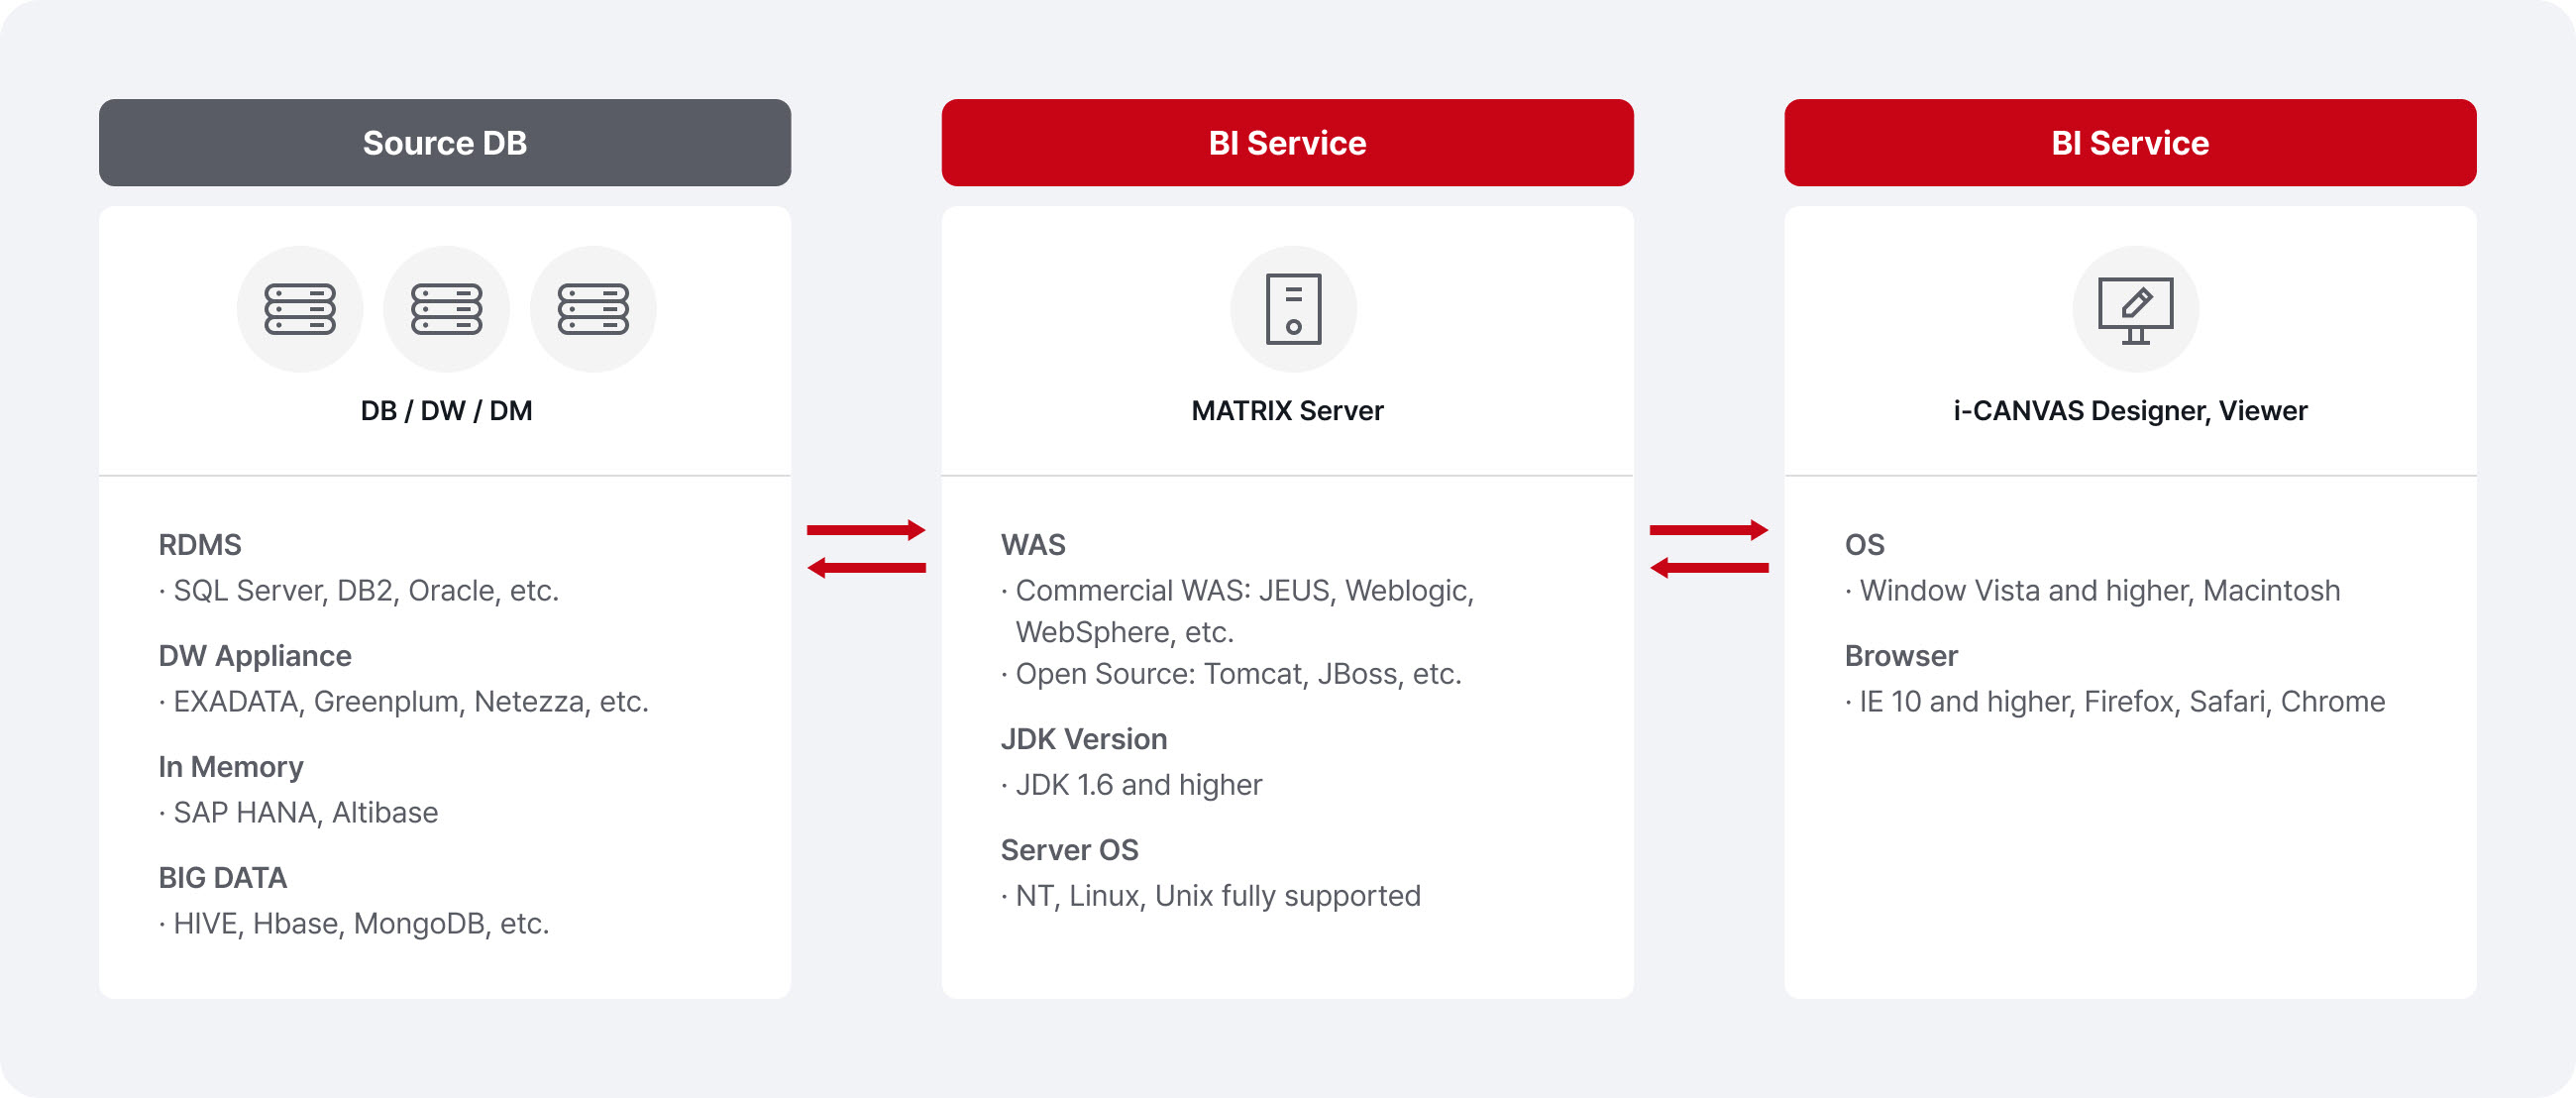
시스템 구성 및 사양
Applications
Application Areas
-

Executive Information Systems (EIS) and KPI Analysis
-
CRM and Marketing Analytics
-
Cost, Profitability, and Financial Analysis
-
Budget Input, Aggregation, Simulation, and Analysis
-
Production, Manufacturing, and Quality Analysis
-
Balance Sheets and EVA Analysis


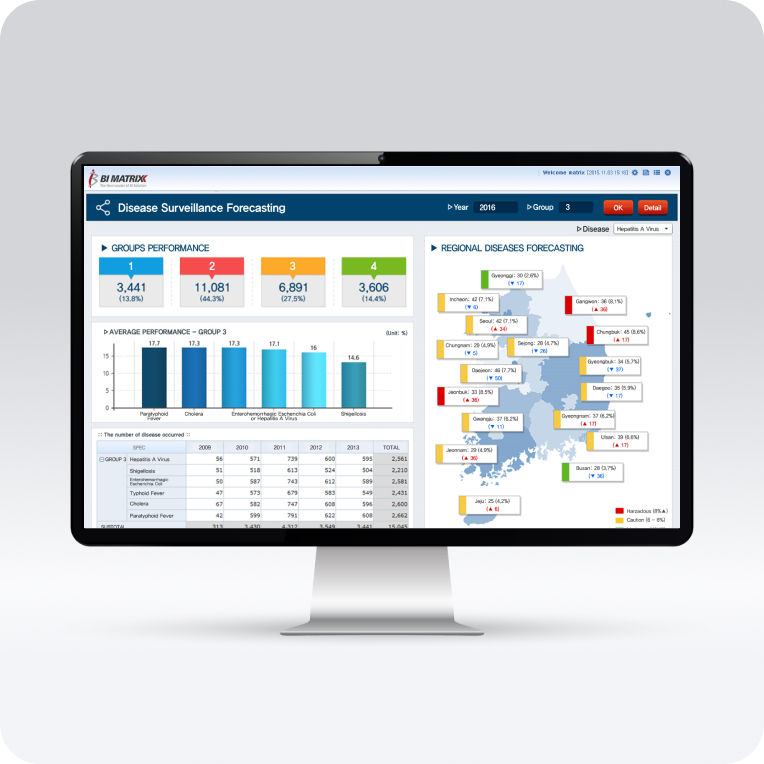
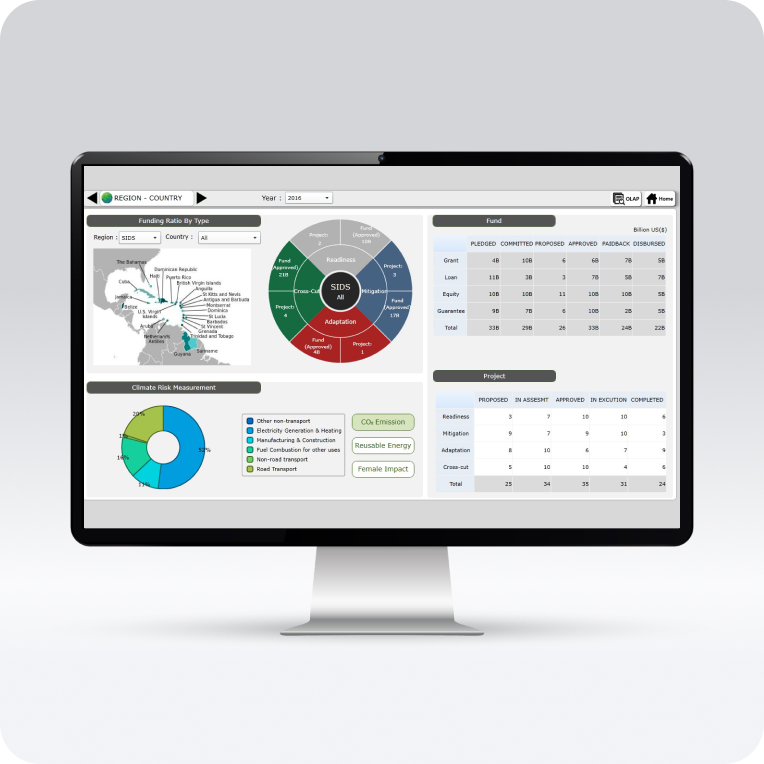
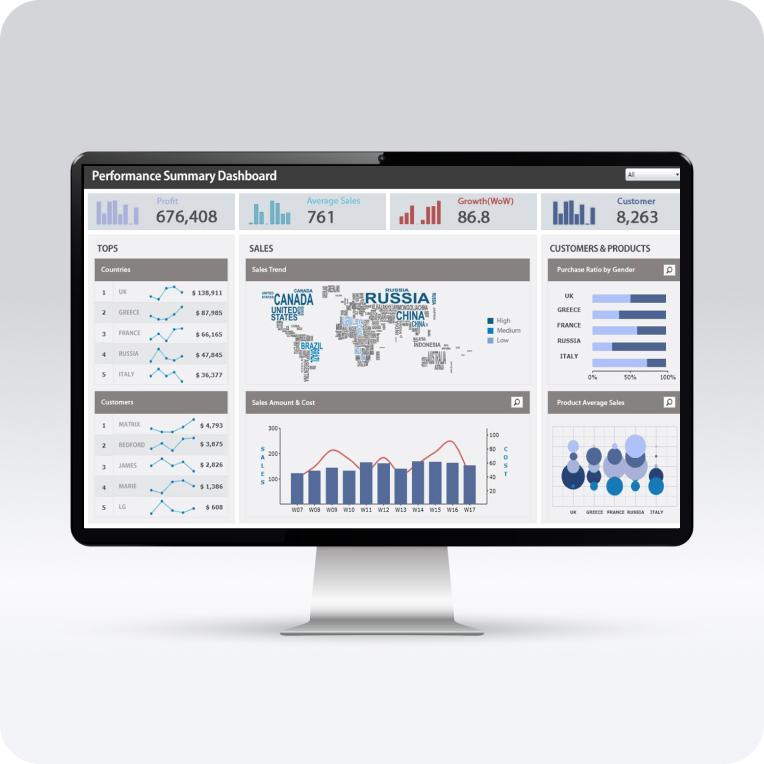
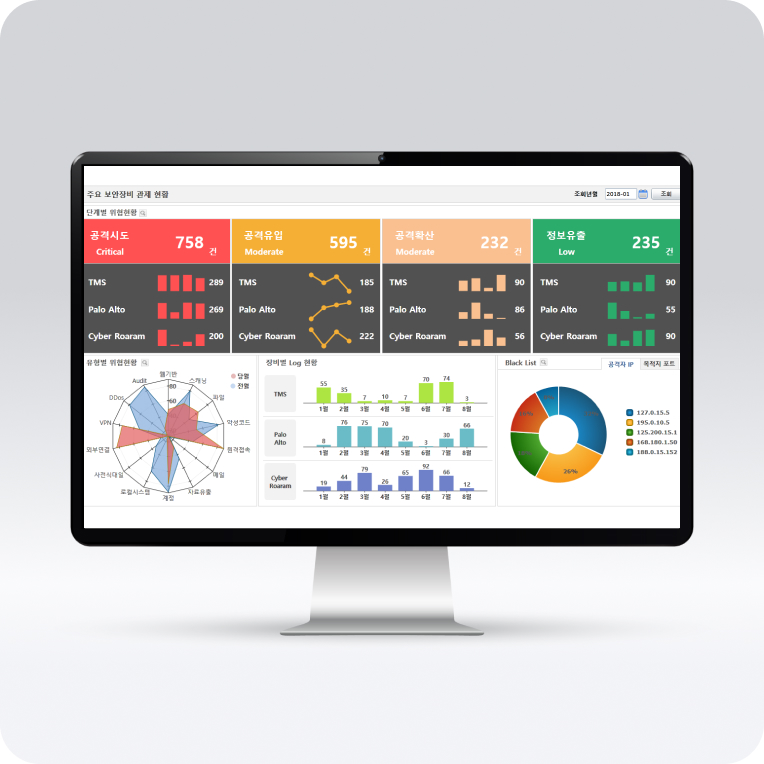
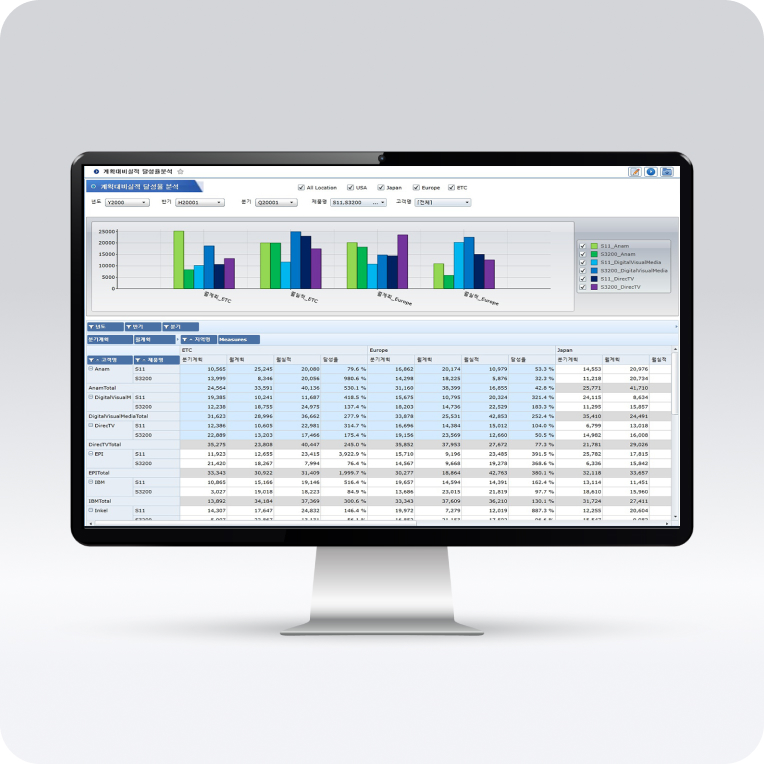
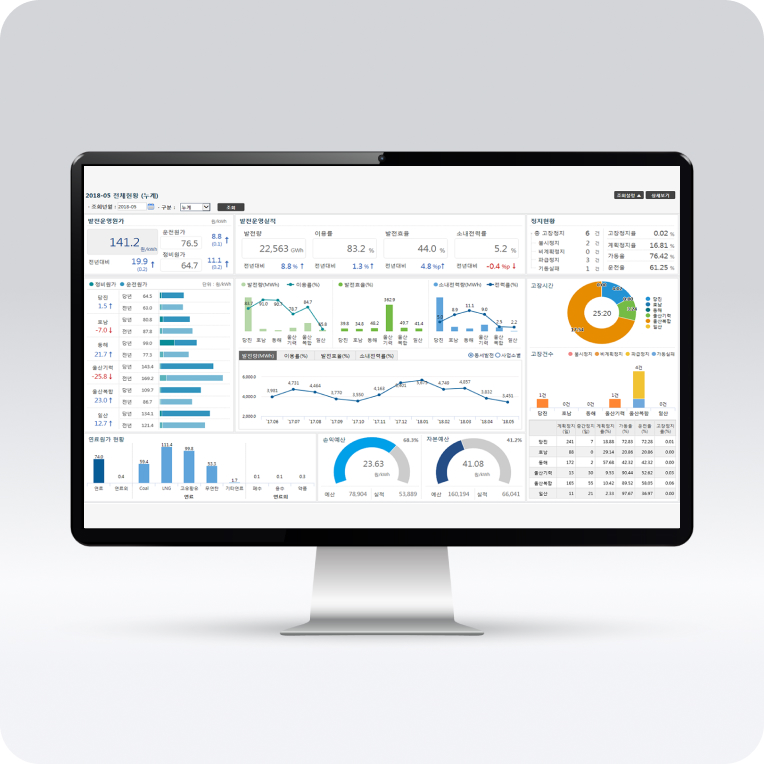
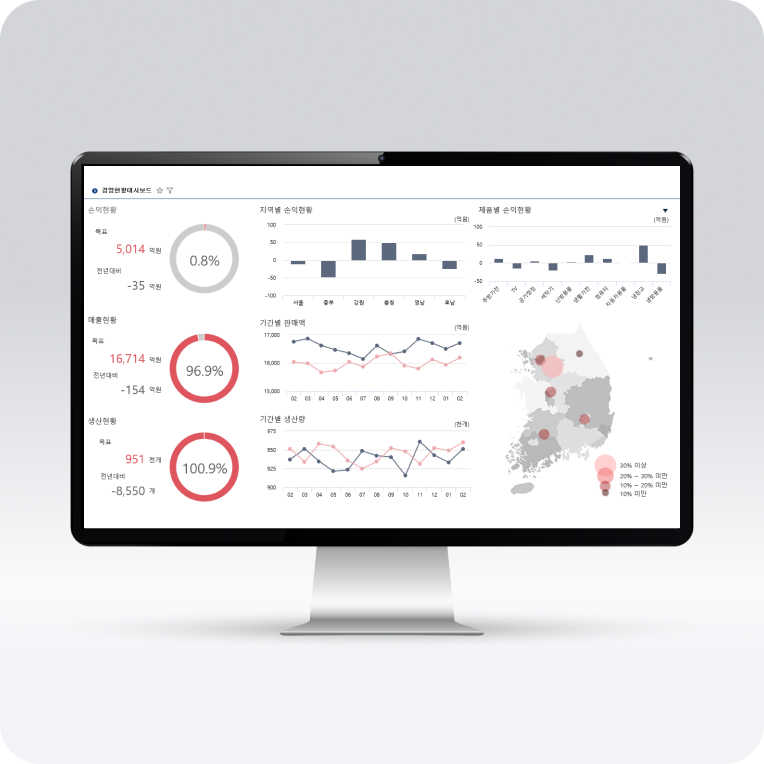
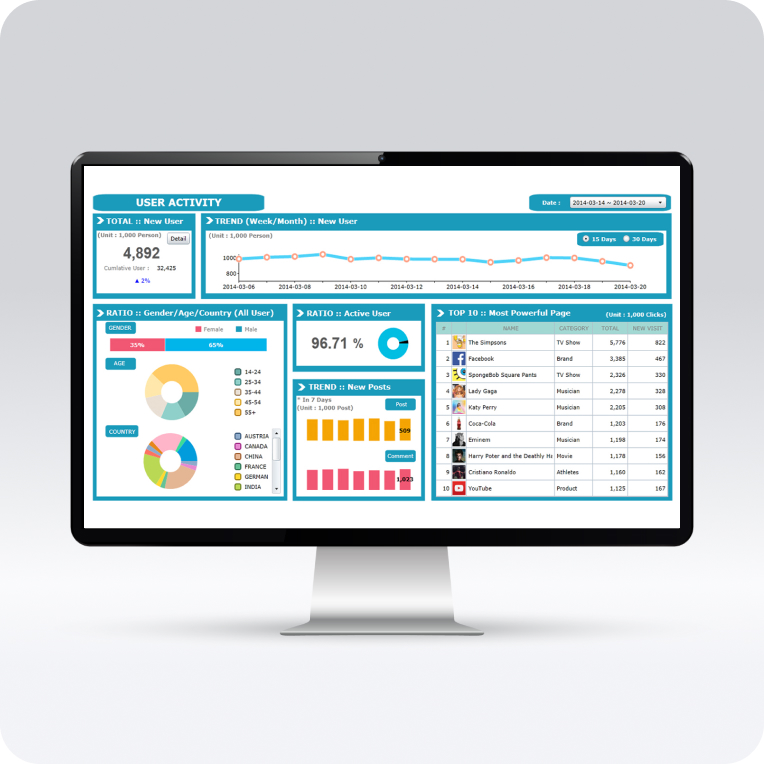
Application Screens